Andy: Choose Either 'Ripple', 'Wave', or 'Tide'

If SWAV is plotted with HA bars smoothed with 3-period MAs, then a green bar appeared last Thursday, Jan 26. That change from Wednesday’s ‘red’ to Thursday’s ‘green’ created a valid 'Buy" signal according to (one version of) Quill’s rules that would be acted on Friday at market open. Here’s the chart, just so we all agree on which bars are which colors.


But if SWAV is plotted with HA bars smoothed with 5-period MAs, that 'Buy" signal goes away, and what you see is SWAV’s continuing long decline.

If you lessen the amount of smoothing by plotting SWAV with 1-period MAs, then a different and more frantic picture emerges.


On Tuesday, Jan 24, the bar is still ‘red’ as before. But look closely at its shape. The upper and lower wicks are long compared to the body of the candle and nearly equal, and the body of the candle is small compared to the size of preceding candles. In short, the candle approximately meets the definition of a ‘Doji’, and we all know what Dojis can signify, namely, buyer-seller indecision as prices close near where they opened (or exactly the same). In classic Candle Pattern Analysis theory, Dojis that occur toward the end of a long trend can often be a highly reliable signal that the trending might change, which is what we see happen on Wednesday, Jan 25.

Therefore, if SWAV had been plotted with HA bars using 1-period MAs for smoothing, we’d have been buying on Thursday and still be in the money (ITM) on Firday, despite it being a down day for SWAV.

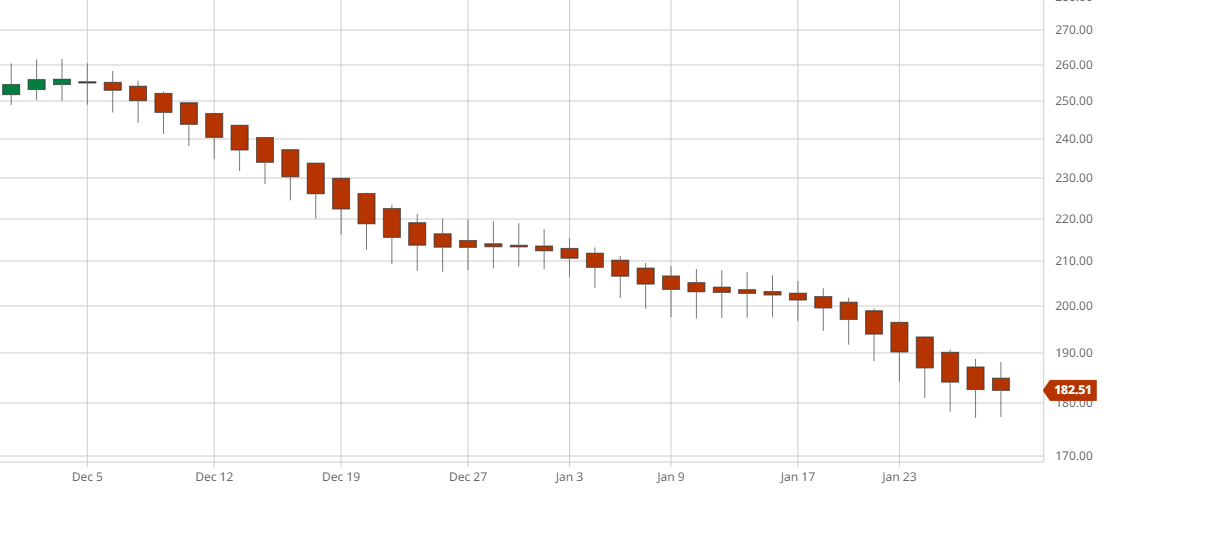
However, look back in the chart. If we had been trying to trade SWAV off of minimally smoothed charts, this would have been our third entry in 2 months. Ditto if we had been working with 3-period smoothing. But if we had chosen 5-period smoothing, we’d be on the sidelines since about Dec 7th. So here’s SWAV again, but with a 3-month lookback.

So this is the question you, me, all of us need to decide for ourselves. “Do we want to be trigger-quick traders, or do we want a more leisurely pace for our entries and exits?”

Whether one chooses to trade the ‘ripples’ or the ‘waves’ or the ‘tides’ of a time-price series will be a personal decision. But it’s a decision that, once made, one probably has to stick with, or else one doesn’t have a trading plan and is going to experience a lot of frustration for seeming to never be in the right place at the right time. Frankly, working from more highly smoothed charts and doing less frequent trading is making a lot of sense to me. But also, it’s going to be hard to get used to trusting that “the trend is really my friend”.

Arindam

4 Likes

That is a really good point and a great post Arindam.

Andy

2 Likes

Just want to point something out at Barcharts.com. If you make a watchlist and then look at the line where it says technical(which gives a drop down menu you can change) to the right is a term called flipchart which allows you to set them up with whatever template you have saved and flip through everything in your watchlist without having to input the ticker symbol.

Andy

1 Like

Once you’ve set up your chart templates --five allowed for free accounts-- you can choose among them as you flip through your flip charts.

1 Like

Ok its off to work. Started with 1990.21 in account and made first trade of ARL at $27.43. This is my first trade in this account and it is a roth account so we will see how this goes.

Andy

Andy,

Very, brave of you to post that trade. Thanks for doing so.

Arindam

1 Like

LOL it’s a trial to see how I do, if you don’t mind Arindam you could critique it. I already made notes that I think the volume might be to low to try and trade that company. I am starting to think it would be better to look for companies with higher volume. But by making mistakes I will learn faster.

Andy

1 Like

Andy,

I did critique your trade. Read my post on ‘How to Vet Stock Tips’. And again – and I really mean it-- you’re very, very brave to call out your trades in real time. Kudos.

As for messing with all but illiquid securities, there are two schools of thought. If you intend to be a ‘trigger-quick’ trader, you need volume, a lot of it, though there are exceptions, such as when the market for that low vol contract is very very “orderly” and the spreads are tight.

As an example, sometime during regular hours, pull a chart for the ETF that tracks the Swiss Franc, using a platform like TOS that is continuing updating and that’s also showing a DOM. Avg daily vol for FXF is a lowly 34k. But it’s possible to get in and out of that contract on a penny spread.

The other school of thought on low-volume contracts is that ‘low-vol’ becomes an asset class that can offer a prem. I’ve got a friend whose whole portfolio consists of owing extremely obscure, extremely illiquid stocks, and he’s making a killing. Also, years ago, maybe 15 or 20, an East Coast money manager made the same point in a YouTube video. “Illiquid can be an asset class.” But to own that kind of stuff, you’ve gotta be an investor in the best sense of that term AND you need the sort of superb risk-management protection that comes with not over-betting your hand.

You, OTOH, are blessed by having option skills. You need to start pairing them with whatever stocks you’re buying, so you’re making money from the composite trade, not just from directional bets on one leg of the trade.

Arindam

1 Like

Greetings,
Thought I’d just add my two-cents worth. More just to reinforce what you stated Arindam. Here’s a chart from TOS. I grabbed a spot in SWAV with some more volatility and have the standard price action on top, then different SMA smoothed HA’s. The first is plain Heikin-Ashi, the next is SMA 8, next is SMA 20 and the last is EMA 20 (not SMA). Just makes the point how much it “smooth’s” out and how deceptive It can actually be. Sorry, but I prefer Candle Trend and that leaves out the filling of the green color for the candle. Tried to change, but ran into some difficulty.

image

It’s interesting that there are actually strategies that use EMA’s 35 smoothed Heikin Ashi. Other than the use to evaluate trend, that really “washes” the details out.

I coded the indicator to be able to adjust the length of the moving average and change between simple, exponential, weighted, Hull and TEMA, (Sorry Arindam, didn’t code triangular……yet). It’s interesting that there is also changes between the type of average. Below is a quick example of 20 SMA-smoothed HA and 20 EMA-smoothed. If you look closely, you’ll see some differences in the timing of change. Bit hard to see in these charts, but it does matter which is used.

image

Anyway, just supporting what has already been stated. If I have time, I’ll try to put up a MTF heat map to also show some of the time differences you see. That is probably where more of the value lies.

Lakedog

PS Grew up on the Grande Ronde. Rafted the annual race a couple times, walked many miles jump-shotting ducks as a kid (back when you could walk a road carrying a shotgun), spent time steelhead fishing at Troy. Love the Cedars and Firs here on the West side, but do also miss the Ponderosa’s.

4 Likes