3 charts that will make you a smarter investor

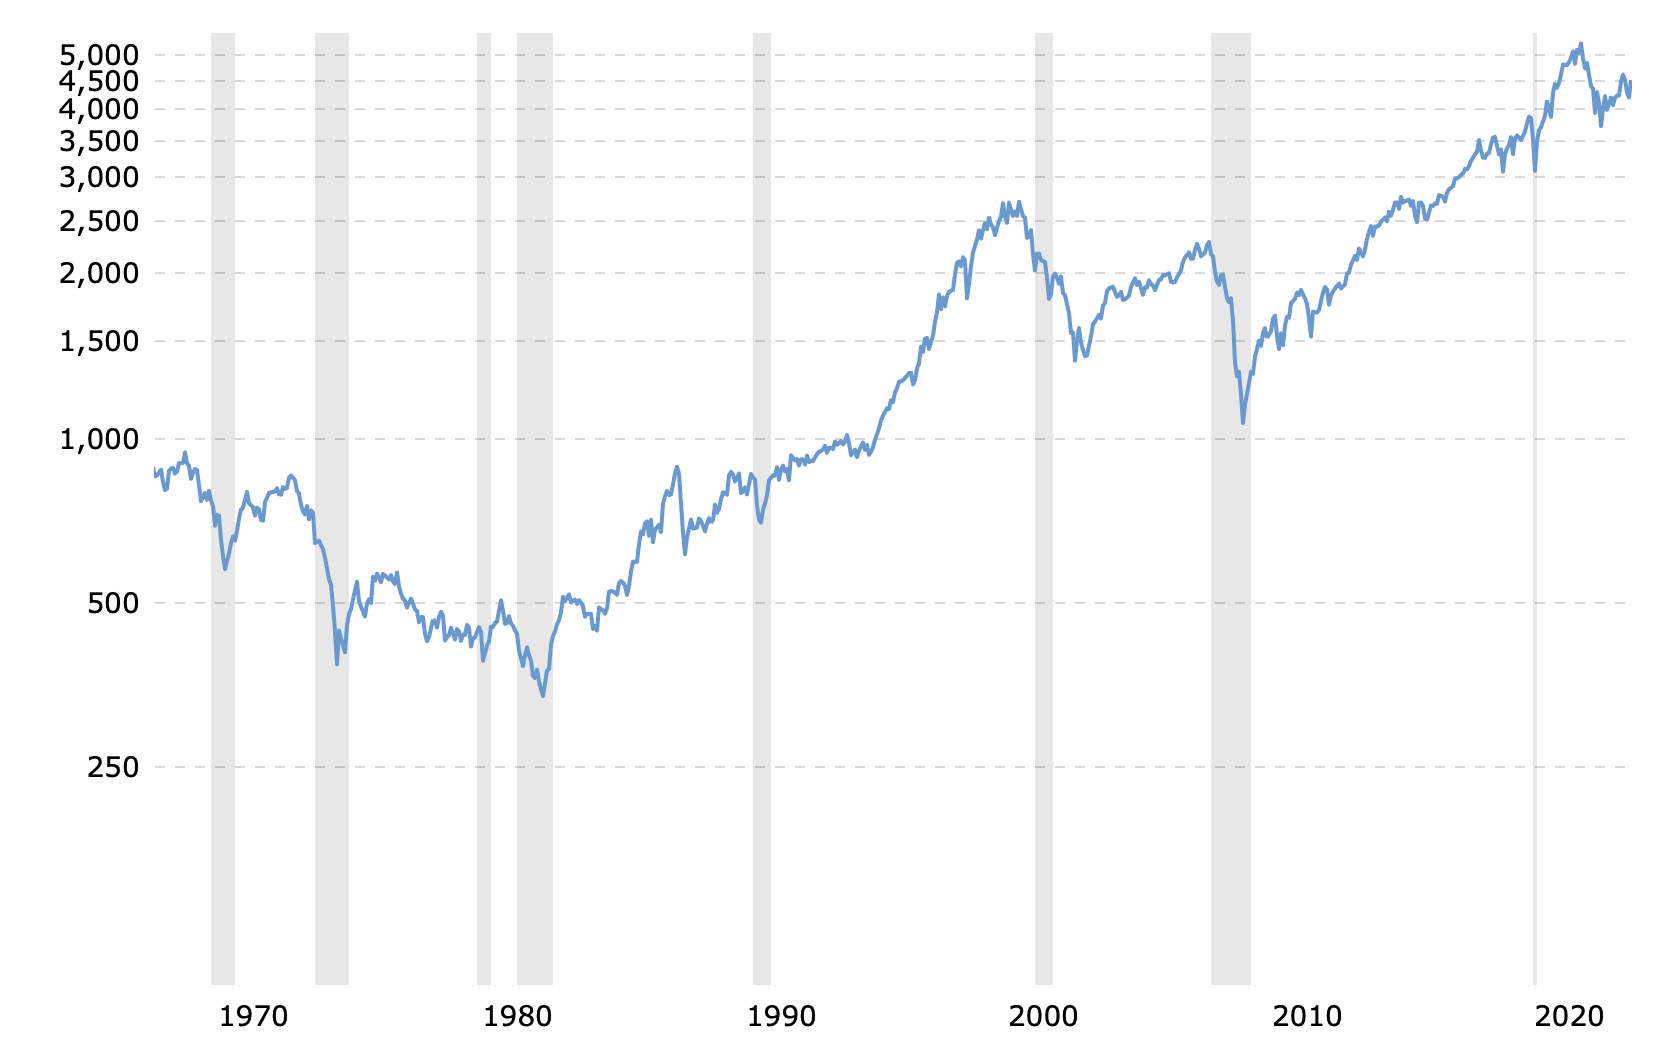
I particularly liked the last one. I stayed out of the market for 2 years after the Black Monday Crash of 1987. I’m about 25% poorer today as a result – education is often expensive.

Fortunately I learned my lesson, and it’s been “stocks for the long run” ever since.

intercst

8 Likes

The problem with that long-term S&P500 graph is that the vertical scale is not logarithmic. Very necessary for those sorts of things.

DB2

2 Likes

Yep. If something is compounding at an annualized 10%+ for decades, you’re going to run out of paper on the vertical.

intercst

Here’s a chart using a log scale. Since it shows percentage changes, the 1987 drops shows up much more clearly.

DB2

4 Likes