In the US Federal spending is 23% of GDP. In the EU the number is 49%. Rob Arnott writes that beyond a certain “sweet spot” (15% to 30% of GDP) government spending imposes a drag on economic growth.
Decades ago, Colin Clark (1945) and Gerald Scully (2003) identified thresholds—around 25% and 19% of GDP, respectively—beyond which taxation and government spending begin to stifle economic growth. Richard Rahn similarly captured this in the now-famous ‘Rahn Curve’…
I guess your “famous” study and your “famous” authors never heard about World War II.
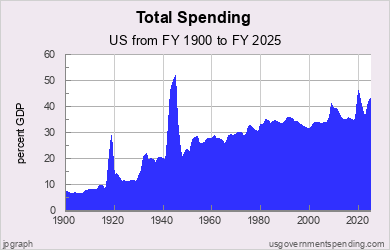
In 1940, government spending was 9.8% of GDP, in spite of convervative cries of FDR’s lavish spending on such things as work relief programs and government projects like the TVA. In fact, many will tell you with a straight face that it was that spending which prolonged the Great Depression, and it wasn’t until World War II came along that’s we got out of that Depression.
Ahem. In 1943 government spending to GDP peaked at 43%, and in 1945 it was still at 40%, and we seem to have come out of it with a pretty robust society, if I do say so.
Maybe tell your famous authors to crack a history book?
Yes, the ‘Laugher’ Curve just says that at a 0% tax rate, the government collects no revenue and that at 100% tax rate, the incentive to work or invest disappears, so revenue also falls to zero. A big, fat “Duhhhh.”
The law of diminishing returns comes into play as to what the tax rate should be and will always be contentious.
The misapplication of the LC, of course, by pols in the 1980s has been shown to be false: that cutting taxes always increases revenues.
Would the law of diminishing returns also apply to how much money the government can/should shovel into the pockets of “JCs”? Is there a point beyond which, further enrichment of “JCs”, by the government, will not resulted in “jobs”, but only enrichment of the few? As to enrichment of the few, once you have a Billion in personal wealth, what is the utility of having a second Billion, other than having more loot than some of your fellow “JCs”? Are dollars nothing but a score keeping system, to see who has bragging rights, and, if so, does that give the “JCs” the right to demand more from the Proles?
The OP paper cites the 2010 Rogoff study that has been partially discredited due to methodology errors:
Growth in a Time of Debt
HAP concluded that the “… the Reinhart and Rogoff point close to irrelevant for current public policy debate.” HAP found:
When properly calculated, the average real GDP growth rate for countries carrying a public-debt-to-GDP ratio of over 90 percent is actually 2.2 percent, not −0.1 percent as published in Reinhart and Rogoff. That is, contrary to RR, average GDP growth at public debt/GDP ratios over 90 percent is not dramatically different than when debt/GDP ratios are lower.
The OP paper has the cause and effect backwards. Low GDP growth spurs higher government spending (e.g. unemployment insurance, covid stimulus checks). Spending on investments (e.g. NIH research) can take 20 years before showing positive returns. So looking at spending is cloudy.
Taxes have a more immediate effect. What do the charts look like when using government taxation? My guess is they do not support the OP idea. Tax receipts are lower in recessions. In the 1990s, U.S. federal taxes increased and the GDP growth rate increased. Federal spending decreased, largely because of less military spending (peace dividend).
Except that the Rahn curve plots plots govt spending/GDP versus growth while the Laffer curve plots tax rates versus government receipts. Not the same at all, as far as I can see.
As far as numbers, that is what the article does put to the idea, along with a best fit regression and a zone of government spending that results in the most growth.
Before FDR, government spending was in the 3-5% range; during the Depression it went up to the 8-10% range. All of these numbers are below the optimal zone of the article (15-30%). For the last half century we have been in the 17-25% range (except for the covid helicopter years). As you noted, that has resulted in pretty robust economies.
Yes, and the screaming from fiscal conservatives during the FDR years was intense. Meanwhile we had Army recruits training with broomsticks instead of rifles, dummy cannons and tanks and other such nonsense, Social Security didn’t exist, there were no relief programs of any sort, the stock market was unregulated, bankers did as they pleased (not always to the benefit of depositors), there were no programs to support the agriculture sector, the TVA stabilized the Tennessee River and began producing power to areas in 7 states which prior had not had it, and tons of job support programs began, like the CCC and WPA and such.
And the scolds were sure that communism had won.
Then came World War II, government spending went up ten-fold (exaggeration), a command economy was, in fact, instituted complete with rationing, government appropriation and direction of industry was common, and the economy boomed.
The comparison is apples to oranges. Making it ignorant.
The EU includes a larger social net that the public wants.
The American public wants the social net as well.
If you include private sector costs in healthcare, some other offsetting funding of retirement costs, and subsidized higher education and trade schools, the costs to the public are more expensive in the US.
Bob you need to stop being so easily swayed by garbage analysis.
True, and yet that has little to do with the current paper that finds the optimal zone to be 15-30% (where we have found ourselves for decades now.
It certainly seems to be what they want and what they have gotten. However, that higher percentage of government spending may also have lead to lower economic growth.
In 2010 the GDP per capita for the EU was about $29K (constant dollars). Last year it had risen to $34K, up 17%. By comparison, over the same period the US went from $53K to $67K, up 26%.
You are either making up numbers or including eastern european numbers.
What is the average per capita income in Ireland?
Ireland GDP per capita for 2023 was $103,888, a 2.17% decline from 2022. Ireland GDP per capita for 2022 was. Ireland GDP per capita for 2021 was $105,561, a 20.55% increase from 2020.
Portugal’s per capital GNI is 50k EUR
Is Portugal a poor or rich country?
AI Overview
Portugal is generally considered a relatively poorer country within Western Europe, but it is still a developed nation and part of the EU, placing it far above the global poverty threshold. While its economy has grown and is considered stable, it faces challenges compared to other Western European nations, particularly in terms of GDP per capita and income inequality.
In general, this a bad comparison … because the data aren’t comparable.
The USA is made up of a bunch of states. And the EU is made up of a bunch of states. The USA has a stronger Federal government (grew over 200+ years) comprising their states, while the EU has a weaker Federal government (only a few decades old). A proper comparison would be USA Federal+State to EU Federal+State. Furthermore, the EU has 94% of medical spending comprised in their state budgets, while the USA has only about 32% of medical spending comprised in the Federal+State budgets. So a proper comparison would adjust for that as well.
Without adjusting for medical spending, the USA government spending is at 43% of GDP. If you adjust for medical spending, the USA is equal or higher than the EU.
Well, countries such a Poland are part of the EU. At any rate, the St. Louis Federal Reserve gives us these numbers for GDP per capita in constant dollars:
2010 $29.4K
2024 $34.9K
34.9/29.4 = 1.187
Again, this is nonsense. We could increase government expenditures dramatically and wind up with almost no change, even improvement, and it would decimate the magic “15%-30%” rubric of your authors.
How? Easy. Socialized medicine, as exists in virtually every other advanced country in the world. The money people now pay for insurance and companies pay for insurance and hospitals pay for unreimbursed care and people pay at retail for doctors visits and all the rest, the ENTIRE health care industry could be included, the number wouldn’t (necessarily) change, it would just come via a different route.
Oops, that would be “government spending” instead of “corporate spending” and “private spending” and the rest. What changes? NOTHING. But the ratio of “government spending to GDP” would change dramatically. So how is this magic formula you promote relevant?
Simple. It isn’t. It’s a fiction, designed to keep the (terrible) status quo, just as Conservatives are licking their lips at the faint, far off prospect of T’s “savings accounts for infants” someday privatizing Social Security, and thereby getting rid of “government spending”, while getting rid of nothing at all.
Pfooey. It’s another shell game, with the con men playing the suckers for rubes, again. Take your magic formula and put it in a desk drawer, or somewhere else the sun don’t shine. It’s nonsense.
A good point, although you would also have to add in EU state-level spending (such as Bavaria) and the separate EU budget.
Not necessarily. If an expense is born by a company or individual then it isn’t government spending (and may affect the economy differently). In addition to health care, there is also a large difference in defense spending between the two areas. Also differences in public transportation, et cetera.
The EU ended up outsourcing more to China. The EU still has barriers culturally to multinationals becoming monopolies across the EU.
But mostly US interest rates were historically lower.
In tandem with that the USD as the main reserve currency is a huge boost.
Google AI result
Potential burdens
Financial Strain: The rising cost of health insurance premiums can significantly strain businesses, especially small and medium-sized enterprises.
Administrative Complexity: Navigating the complexities of health insurance plans, regulations, and compliance requirements can be a significant administrative burden for businesses, potentially diverting resources and focus from core business activities.
Reduced Competitiveness: High insurance costs can make businesses less competitive, particularly when compared to larger organizations that may have greater bargaining power or self-insured options.
Limited Options: Small businesses may have fewer options for plans and negotiate lower rates, potentially leading to less comprehensive coverage and higher employee out-of-pocket costs.
Uncertainty: Unpredictable premium increases and the potential for regulatory changes can create uncertainty for businesses, hindering long-term planning and investment.
Don’t listen to the naysayers Bob! Sometimes it’s better to take a complex relationship and just dumb it down so much that even Cletus can understand it. After all, how are the rich going to convince their supporters to keep giving them money with some convoluted mumbo jumbo?
I apologize, that reads a bit snarky.
Take 2 - not all government spending is the same. The paper, the infamous Rahn Curve, and similar arguments don’t account for this simple, yet very important fact.
Some spending drives economic activity, some doesn’t. Take @Goofyhoofy’s WWII example. All that spending boosted our economy because it put people to work and made the US a manufacturing powerhouse.
Numbers are just numbers, government spending’s impact on economic strength is a complex subject. Superficial “research” makes us all a little bit dumber.