If you’re bored, I would be curious if anyone’s chart formulas gives a SELL or HOLD on GIS. Thank you in advance. Earnings are 5 weeks away.
I picked up this position in 2020 as a covid play, did not sell covered calls against it.
So if all the lithium in the world is going to go into batteries, I think I’ll make it a point to…1. never tailgate anyone who is hauling a boat trailer down the road, and 2. avoid being around people I don’t know on nights of a full moon 
2 Likes
Blacktree,
You’re way late in getting out on ths one.
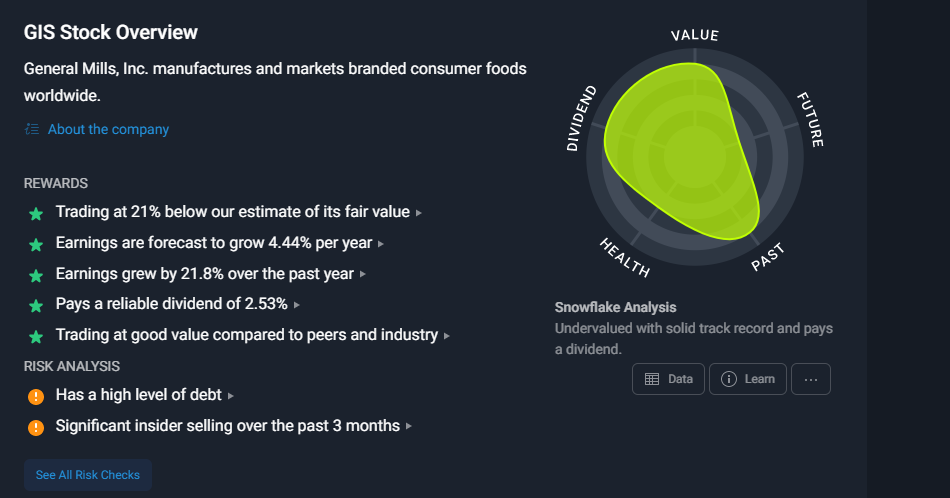
From a fundamentalist viewpoint, GIS doesn’t look too bad. For sure, its weak financials are worrisome, as is the forecast for very low earnings growth, and the div is sucky. But GIS is a big player the the food industry, and it isn’t las likely to fold in the coming depression as are the over-bought techie darlings.
My suggestion --for them not already long-- would be to put it on a watch list --along with HD, LOW, MCD, WMT, COST, etc.-- and then wait for prices to become attractive enough to initiate a position. In short, do the Ben Graham thing.
TY. I’ll probably wait and see if it levels off here, and see how the numbers and guidance are on June 26th. Share price did recover from its lows earlier this year. I remember the outlook for GIS being pretty positive in March.
I checked for GIS news articles in case there was an explanation of the recent decline, and the first one that popped up was an announcement that the marshmellows in Lucky Charms now change color when the milk gets poured into the bowl. Good Grief!!
(Can you imagine some recent graduate, with their masters or Phd in food science or some such thing…and they go to work for GIS, and they get put on a team with other pretty sharp people, and they are all expecting to have a great impact in the food industry, and make life better/healthier for millions of people…and they get asked to make little marshmellows that change color.
Blacktree,
Why major food producers aren’t doing better than they are in present market conditions is beyond me to understand. (Probably the explantion is their inability /unwillingness to pass on to the customer the full impact of the inflation they are experiencing in input costs.
Earlier in the year, I traded Tyson and a couple others successfully and took a nice profit on my bet on avocados and one on wheat. But by and large, food has been tough to trade.
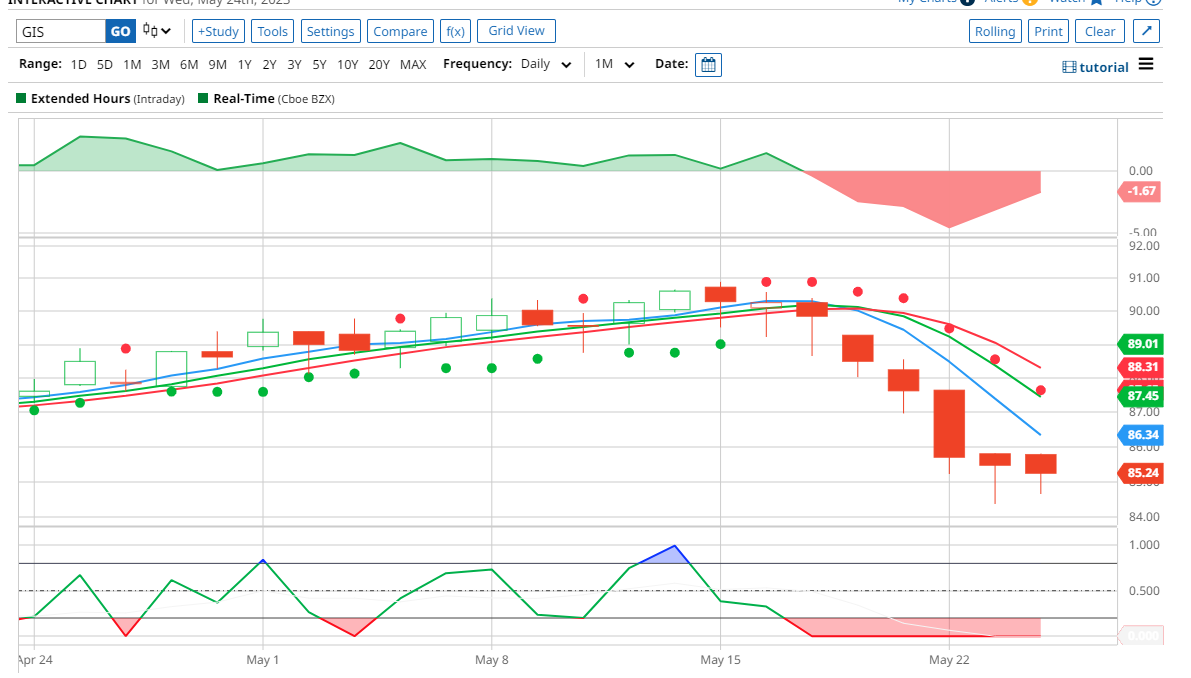
Blacktree, how long have you held it. If you are trading it on the cycle then you are on a downtrend and missed the sell point per TA like Arindam says.
You could still sell and jump back in when the trend turns positive. Arindam always says the chart doesn’t lie. Of course hindsight is 20:20 but it looks like the 15th was the last day of this current wave and then on the 16th or 17th the bars are going red indicating a reversal of trend. This looks like a good stock to swing trade looking at that 12 month chart. Of course just my humble opinion…doc
3 Likes
Bought this position around three years ago, and just closed it out, I’ll wait to see how earnings look next month. I’m happy with the return I got on it.
2 Likes
“You could still sell and jump back in when the trend turns positive. Arindam always says the chart doesn’t lie.”
Doc,
That saying about charts not lying should be credited to Quill, not me. He’s the one who --correctly-- insisted on trading on “The facts, Ma’am. Just the facts.”
But the reality isn’t quite so simple. Just as 10Q’s and 10Ks can be spun, tapes can be painted, creating charts that are intended to mislead. Nor is this something new. Traders 100 years ago were spoofing to obtain an advantage over their counterparty, as Livermore reports in his semi-autobiography. But a plain, price-and-volume chart is about as close to "the truth’ as a retail investor is going to get, and it’s what should be trusted when it conflicts with “the narrative” that Quill --again rightly-- said shouldn’t never be trusted. So his full saying was this: “People lie. Charts don’t.”
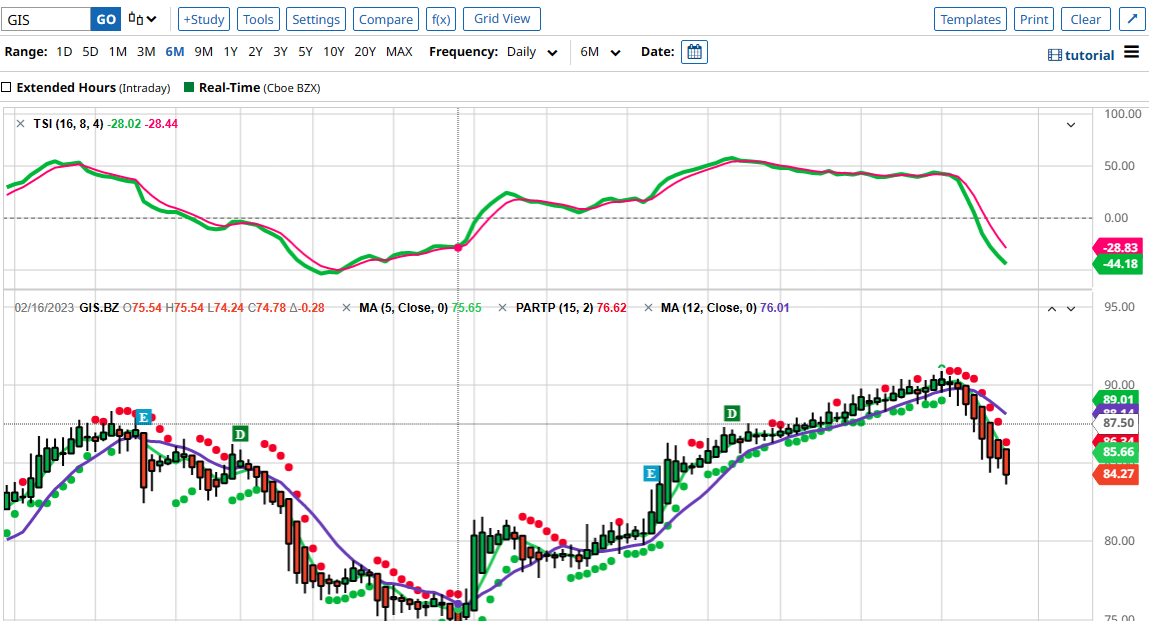
As for how to have managed GIS, here’s a chart that sugeests what coulda/shoulda been done, namely, trade the channel
3 Likes