Come on baby light my fire! - A history of firewood in the US economy. Long story short, as coal prices declined, coal replaced firewood as the nation’s primary energy source. Coal was later replaced by oil and gas. Cheaper energy sources always win out! With wind energy now being cheaper than coal, makes you wonder why our current administration is living in the past.
Pow, Pow, PAC - Pro-gun PACs strategically target districts that experience fatal school shootings. Despicable.
NIMBYism is more contagious than measles - How housing shortages and the spread of NIMBYism exploded housing prices.
More kindergarten = mommy bringing home more bacon - How early childhood education changes impact employment for mothers.
That’s because wind isn’t cheaper on an electrical system basis. It is easy to find claims that the LCOE (levelized cost of energy) such as solar and wind are lower than, say, natural gas. However, that assessment depends upon what is included and what is left out.
A research paper by Idel looked at what he called LFSCOE, the levelized full-system cost of electricity.
For comparison purposes Idel calculated the system costs, including intermittency and storage, for a given technology in a market supplied solely by that technology plus storage. Real world systems would obviously be a blend of sources.
Because location plays a large role, calculations are presented for two locations, Germany and Texas. His Table 2 gives the costs in $/MWh.
          Germany   Texas
Solar       1548     413
Wind         504     291
Wind/Solar   454     225
  combo
Nuclear      106     122
Biomass      104     117
Coal          78      90
Gas CT        39      42
Gas CC        35      40
It is important to note that the motivation of this paper is to introduce a novel methodology of calculating costs and then use this methodology to examine some relevant counterfactuals. Given the simplifying assumptions, the numbers should not be seen as definitive.
You keep bringing up natural gas. I’ll grant that it’s cheaper and cleaner than coal, just like wind energy.
Please explain why TFG is pushing coal. Economically…it’s stupid. Taking into account climate impacts…it’s stupider. Should we be expecting to reinvigorate the whale oil industry?
Just put “ish” after all the numbers, that should fix it.
That’s great news! Now, if half the country could commit to running hard due west for the next 1291 days, maybe we can shave 6.5 seconds off our current predicament.
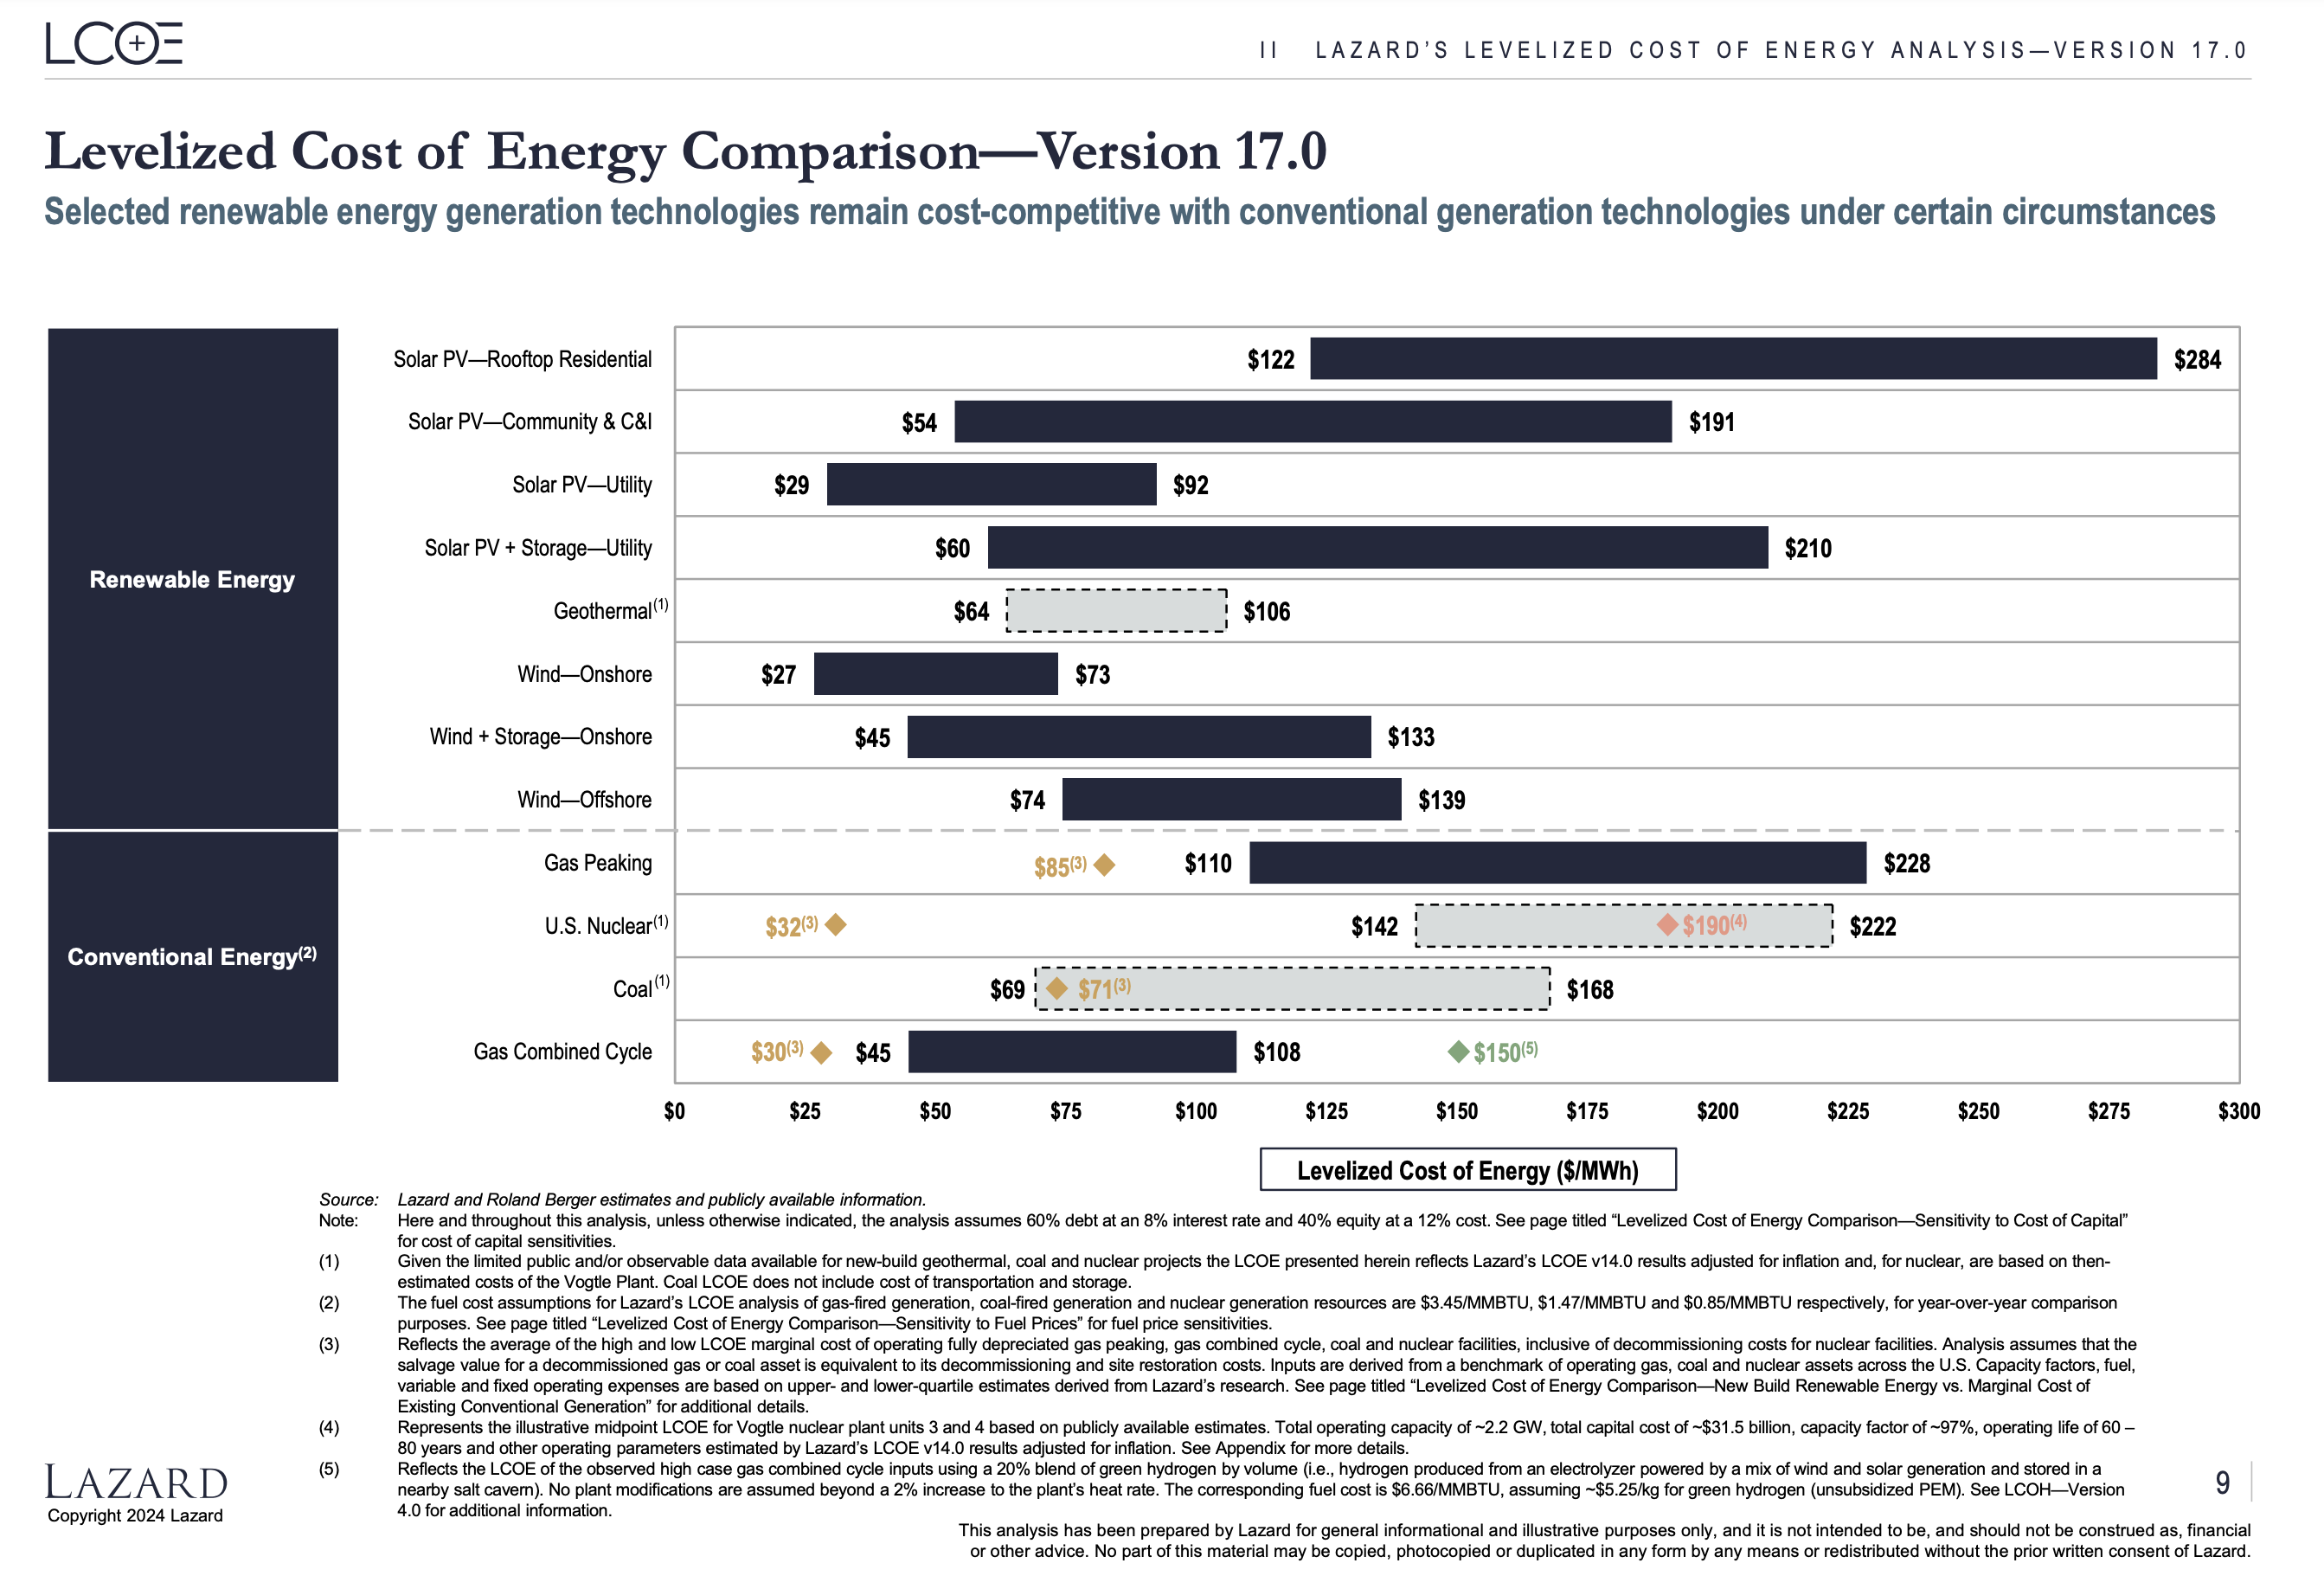
That chart is interesting.
The problem is that the “residential solar PV” is competing with the retail cost of electricity that the home owner pays and all the others are competing with the wholesale prices that utilities pay or provide.
What is left out are the grid costs such as connection costs and balancing costs; these system costs increase as renewable penetration increases. The IEA uses a term VALCOE (value-adjusted cost of energy) and writes:
Power generation technologies primarily generate electricity (or energy) but also provide other services that are critical to the adequacy, reliability and quality of electricity supply. Among technologies that have similar operational characteristics and play similar roles in power systems – and therefore have similar value to the overall system – the LCOE can provide a robust metric of competitiveness. But not all power technologies contribute equally to these essential services.
These system differences have been know for years but are generally ignored at low penetration levels. Way back in 2012 the OECD put some number to these costs for six countries (France, Finland, Kores, US, UK and Germany). The cost for battery backup has obviously decreased since then. However, even with the backup costs reduced by 90%, the US costs for renewables are more than an order of magnitude higher at the 30% penetration level.
       Total grid-level system costs
              USD/MWhr
Nuclear           1.67
Coal              1.03
Nat gas           0.51
Onshore wind     14.31
Offshore wind    22.10
Solar            18.87
“By capturing technology-specific costs and a wide set of value streams, the VALCOE provides a robust metric of competitiveness across technologies with different operational characteristics, including solar PV with and without storage, and more generally between variable renewables and dispatchable thermal technologies. However, the VALCOE does not attempt to be all-encompassing, as it does not account for network integration and other indirect costs, such as those related to pollution.”
Pollution is costly.
Whoa 13 years ago! I bet if we go far enough back, we can find something showing firewood as more cost effective than wind…
Battery backup wasn’t the only thing that was more expensive back then. Overall costs for solar and wind have come waaaaaaaaaaaay down.
Weird. Texas is far better located to take advantage of solar.
In terms of potential for solar energy production, Texas surpasses Germany due to its superior solar resources
. El Paso, Texas, for example, receives roughly double the solar influx of Berlin, Germany. Texas also boasts an estimated "gross technical potential" from photovoltaics (PV) that could power the state 10,000 times over. Germany's solar resources have been compared to those of Alaska, with less sunlight received than in most of the continental United States.
However, despite Texas's greater solar potential, Germany has historically been a global leader in solar energy adoption and installed capacity. This can be attributed to Germany's early and aggressive push into renewable energy through supportive policies and incentives, Germany has recently achieved its target of 88 gigawatts (GW) of solar capacity and in May 2024, solar power supplied over 60% of Germany's electricity for several hours a day.
Ah so Germany wins because they don’t have the huge gas & oil lobby pulling down the competition, not because “it’s better.”
If you call it winning when you spend your money on a more expensive source with a capacity factor of only 10%.
Well, then there is the issue of subsidies. Under our last administration (2022 numbers) the EIA published a report on federal energy subsidies. In it they write that “most federal subsidies were for renewable energy producers (primarily biofuels, wind and solar) low income households and energy efficiency improvements.” 46% were for renewable energy and 35% for end users.
Here are the 2022 numbers by energy type. And this is pre-IRA with its massive spending.
              Million $
Solar          7,522
Wind           3,592
Coal             873
Nuclear          390
Geothermal       353
Biomass          312
Oil & Nat Gas  2,304
But wait! There’s more! If we look at the money spent per amount of energy actually produced the difference becomes greater than an order of magnitude.
         Million$ per TrillionBTU
Solar           4.153
Geothermal      1.665
Wind            0.947
Coal            0.072
Biomass         0.060
Nuclear         0.048
Oil & Nat Gas   0.033
I believe they all include the cost of carbon, starting with LCOE. For example, from the 2023 Lazard report we read:
“Lazard’s Levelized Cost of Energy (“LCOE”) analysis addresses the following topics: Comparative LCOE analysis for various generation technologies on a $/MWh basis, including sensitivities for U.S. federal tax subsidies, fuel prices, carbon pricing and cost of capital”
Um, I think you’re mistaken. Pollution costs, along with a slew of other costs, are not included. From slide 1 of your link -
"Other factors would also have a potentially significant effect on the results contained herein, but have not been examined in the scope of this current analysis. These additional factors, among others, could include: implementation and interpretation of the full scope of the Inflation Reduction Act (“IRA”); network upgrades, transmission, congestion or other integration-related costs; permitting or other development costs, unless otherwise noted; and costs of complying with various environmental regulations (e.g., carbon emissions offsets or emissions control systems). This analysis also does not address potential social and environmental externalities, including, for example, the social costs and rate consequences for those who cannot afford distributed generation solutions, as well as the long-term residual and societal consequences of various conventional generation technologies that are difficult to measure (e.g., nuclear waste disposal, airborne pollutants, greenhouse gases, etc.)"