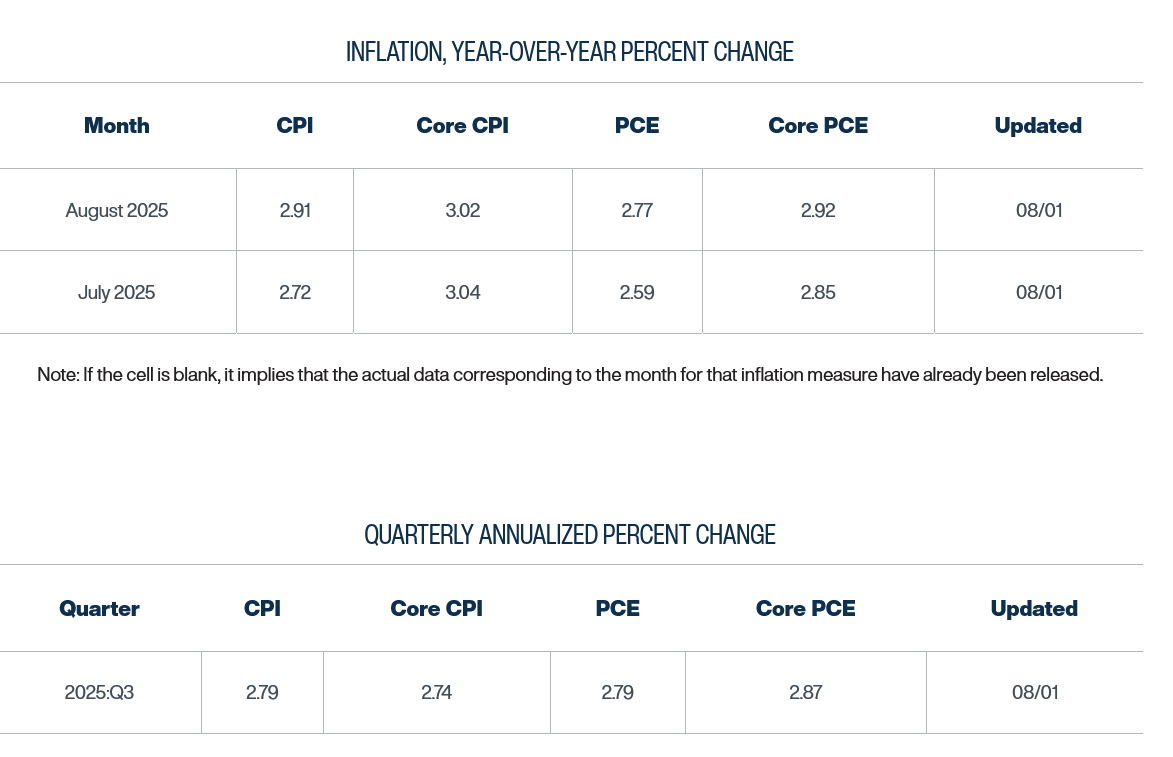
Stagflation is a combination of inflation and economic stagnation. It’s tough for the Federal Reserve to handle because stimulating the economy with lower interest rates exacerbates inflation. That was a problem in the late 1970s.
Today’s news shows the hint of stagflation in the employment and inflation numbers.
The July jobs number was lower than expected and the previous two months were revised downward.
Any thoughts on why the job report revisions were so large?
“Revisions for May and June were larger than normal. The change in total nonfarm payroll employment for May was revised down by 125,000, from +144,000 to +19,000, and the change for June was revised down by 133,000, from +147,000 to +14,000. With these revisions, employment in May and June combined is 258,000 lower than previously reported.”
I don’t know why anyone would be surprised by this. With historically low unemployment, immigration is the only practical way to increase job gains. With immigration locked down, the job gains that were reported in May and June would have only been possible with more dramatic decreases in unemployment…which we didn’t see.
We’re at the point that any reduction in unemployment will only be accomplished through serious wage increases. With many businesses already experiencing labor shortages, and more to come, there’s an additional upward pressure on wages.
Higher wages drive inflation. Maxed out labor resources drags on the economy. Seems like conditions are ripe for a stagflation DOOM loop! Er, I mean, challenge loop.
Say a new government had recently come into power. A number doesn’t look good. So “artfully” lower preceding numbers, and blame them on the predecessor. Then the current head can crow about the “huge improvement” in the most recent number, for which he takes credit.
any resemblance to current events is probably only a coincidence
Another way to increase the number of jobs is increasing Labor Force Participation. This peaked in April 2000 at 67.3%, and is now 62.2%.
Working age population has dropped about 6% since 2000.
Labor Force Participation / working-age population is about the same:
April 2000: 67.3% / 84% = 80%
July 2025: 62.2% / 78% = 80%
Because the labor statistics chief is incompetent! TFG just fixed that -
All the numbers will be better going forward.
True dat, which also puts upward pressure on wages.
Or…we could assume that a lot of working age people are just milking it on the government’s dime and we need to make their life as miserable as possible to push them back to work. Look at me, I could work for Project 2025!
Those are some interesting links for these interesting times (firing the jobs reporter, and tracking Project 2025). Less than 1% of the U.S. population directly works for the federal government.
The types of federal government jobs are changing. There will be fewer scientists and more police. Seems like 1984 might have finally arrived.
So, lets impose the Medicaid work requirement NOW, not wait until after the midterms. Drive people into the arms of the “JCs”, to take any job, at any lousy pay.
Here’s a thought, suspend the minimum wage, as, we are told, it would “create jobs”.
Everything will be the biggest and bestest ever, in the history of the world. What an amazing turnaround for a country that had been so victimized by everyone else in the world for so long.
I don’t see a 90% change in early 2024 seasonally adjusted numbers. Was someone fired, for the numbers they reported, at that time? I see a really punk “job creation” number for October 24. Was anyone fired for reporting that number?
Here is my very non-expert guess. The US economy is in much worse shape than most people think. The vast majority of job creation over the past three months has been in health care. It has not occurred in industries that build or create stuff. Health care job growth is not impacted much by stupid tariffs policies, stupid trade policies, stupid immigration policies. On the other hand, stuff like manufacturing, construction, information/software development are greatly impacted by such stupid policies.
The job creation report is based on sequential surveys so the big revisions must have resulted from the initial responses coming from companies confidently hiring and the later responses from companies that were more pessimistic. I’m guessing that in the last couple of months, the initial responses came from a disproportionate number of health care companies, not surprising if the rest of the economy is making last minute decisions to curtail hiring because of stupid and unpredictable government actions.
Bottom line is that under the trump administration the US economy is “growing” primarily because Americans are getting older and sicker and therefore need more health services. America is not building or creating more stuff. The Chinese are, but the trump economy is moving in the opposite direction.
Keep in mind that the Fed tries to control unemployment rates and inflation. The stagnant job creation during the trump administration has not increased unemployment rates so far, an indicator of the national labor shortage. If in September unemployment remains low while inflation is rising because of tariffs, will the Fed reduce rates?