I was listening to the news report after the 1987 crash.

I find these very informative as it gives one the perspective. It is more informative than what you can read in books and AR.
Here is how DJIA looked in 1987/1988. 22% drop. Panic !

Here is how DJIA looked 5 years later. Painful 5 years but making new highs.

Here is how DJIA looked 10 years later. What 1987 ?

Here is how DJIA looked 20 years later. 2009 stands out. 10x returns. The march continues.
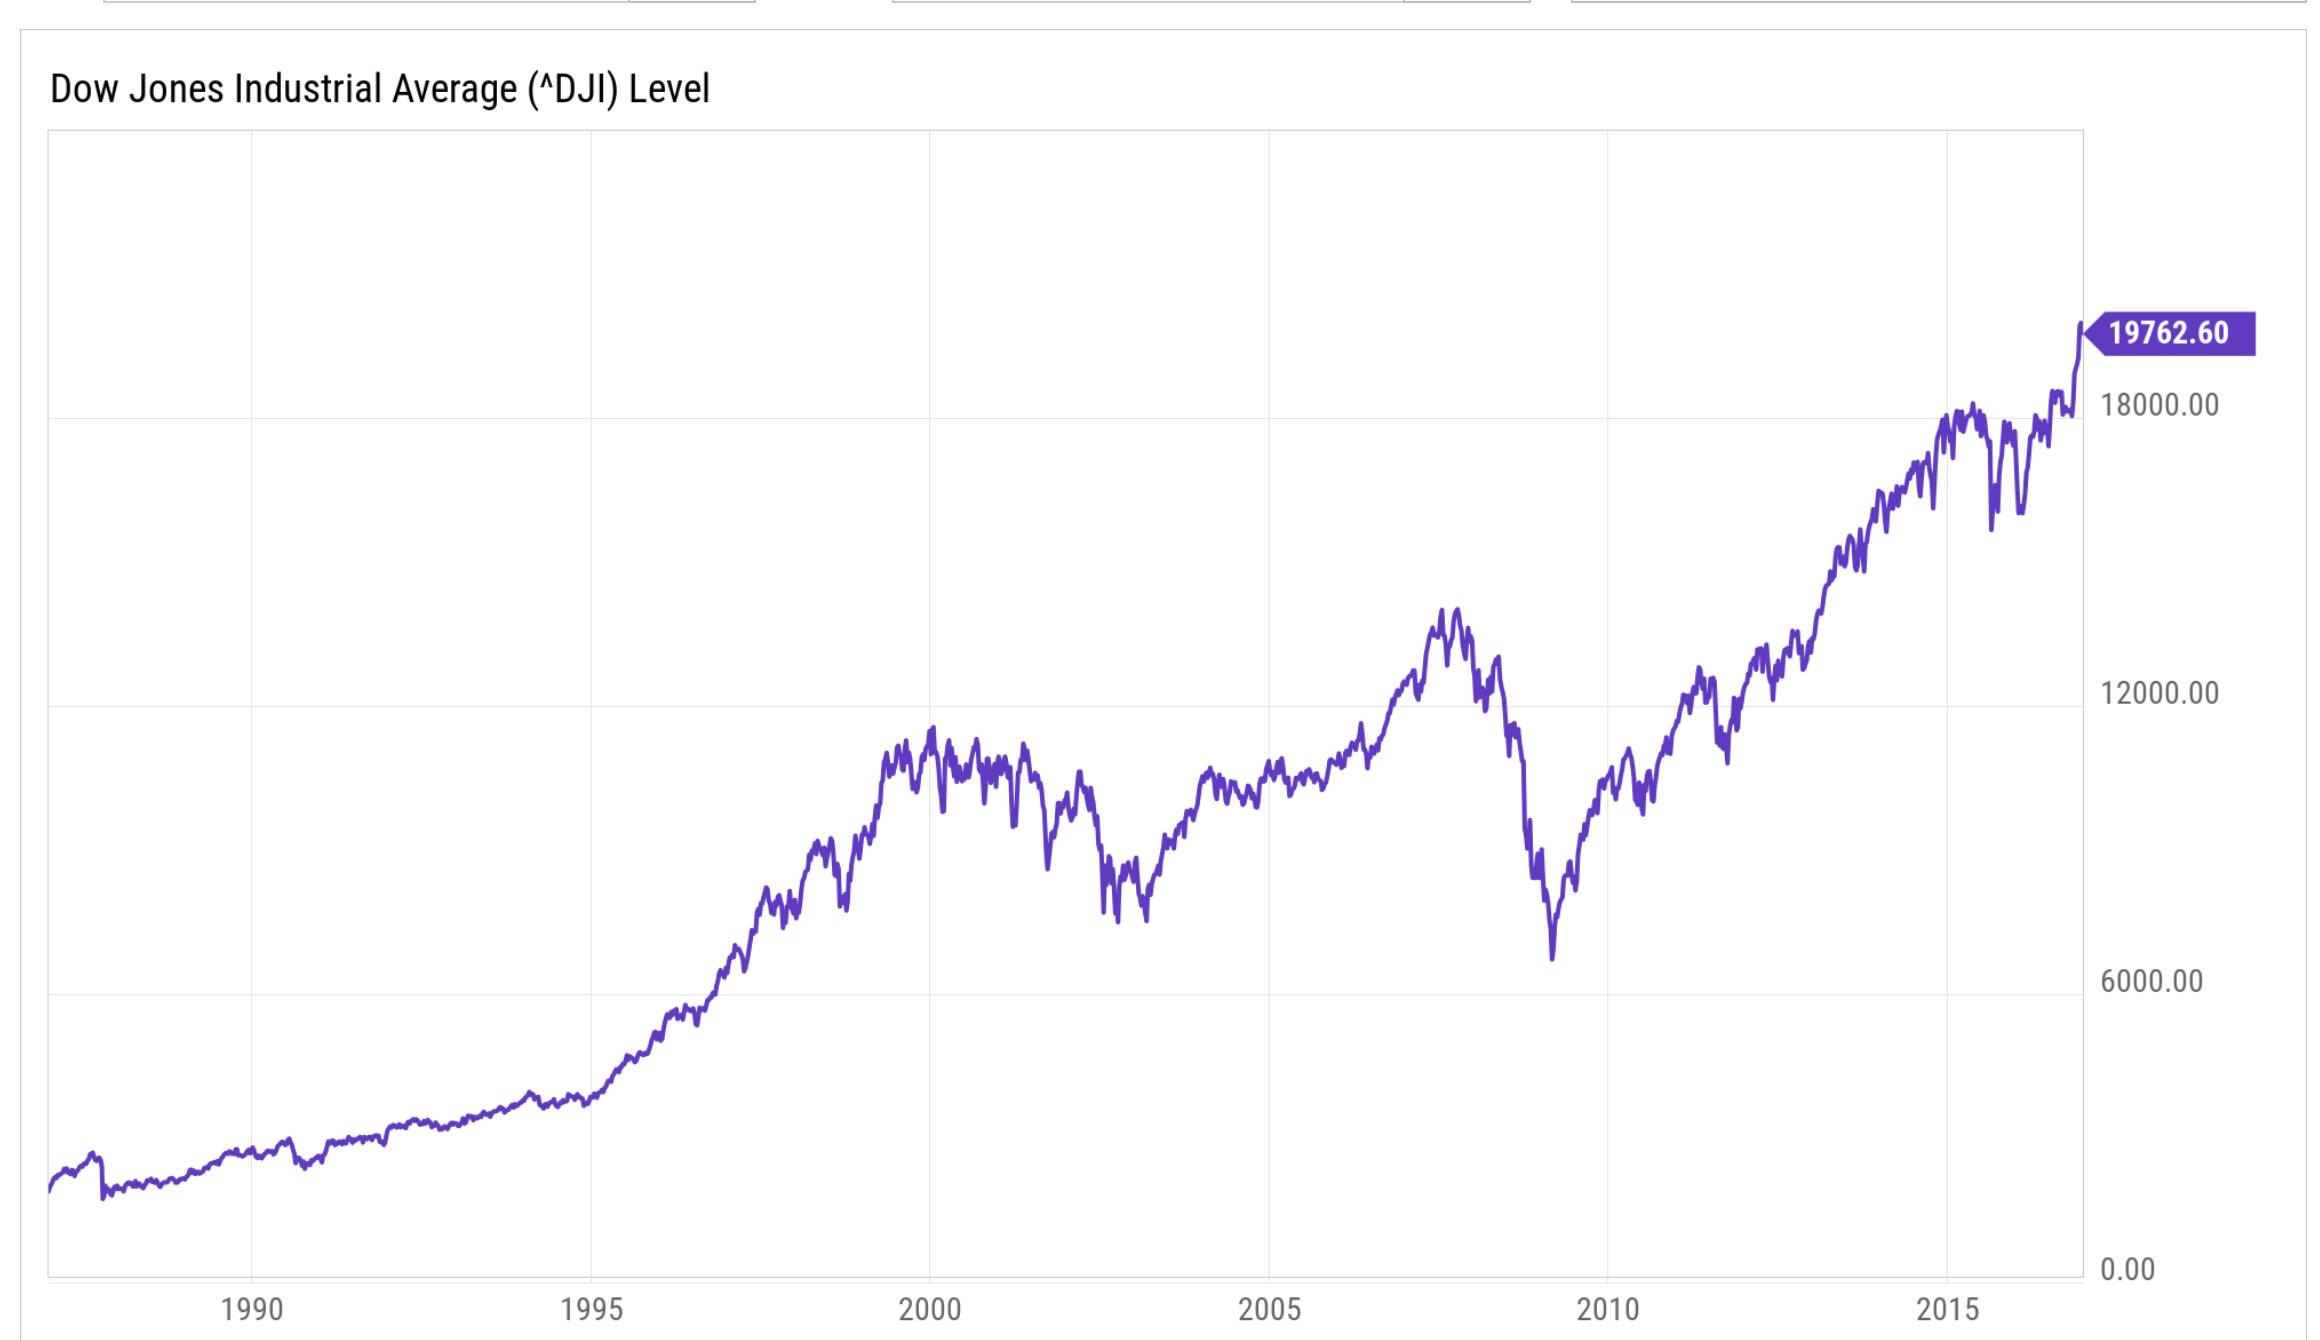
The blip on the bottom left is 1987 crash. How will BRK and S&P500 look in 20 years ?