https://www.wsj.com/finance/stocks/sp-500-rally-sectors-efe6ba9b?mod=hp_lead_pos2
The Stock-Market Rally Is Moving Beyond Big Tech and Investors Are Thrilled
One measure of market breadth recently touched a new high, as financial and industrial names fuel stocks’ climb
By Hannah Erin Lang and Roshan Fernandez, The Wall Street Journal, June 28, 2025
…
While the so-called Magnificent Seven tech stocks still hold investors’ attention—and sway over the market—a broader participation in the recovery has helped propel the Nasdaq Composite and the S&P 500 to all-time-highs in June…
Wall Street generally views improving breadth as a signal of a healthy stock market and a sustained advance. Whether the trend continues will depend on a few uncertainties still looming in the second half of the year: potential conflict in the Middle East, the path of interest-rate cuts from the Federal Reserve and the final outcome of President Trump’s tariff plans… [end quote]
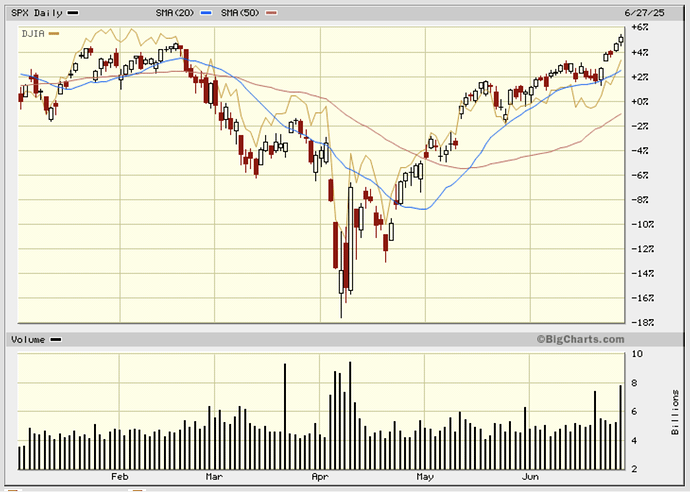
All METARs are aware by now that the S&P500 has reached a new record high. The linked WSJ article says that the stock market rally is widening beyond the Magnificent 7 but the chart shows that rally in the equally-weighted S&P 500 is not outpacing the rally in the cap-weighted S&P500.
Despite the many recent adverse events the stock market is rallying and VIX is down. The percent of stocks in the SP100 over their 200-day moving average is 67% and this is in a positive trend.
The Fear & Greed Index is in Greed. The trade is risk-on since junk bonds are rising along with stocks. The price of the 10-year U.S. Treasury is rising (yield is falling) in parallel with SPX but SPX rising faster.
The USD is still within its broad rising trend of the past 10 years but it began to drop in January 2025. Gold fell in the past week but that’s noise. Oil prices popped after the attack on Iran but immediately fell back.
The Treasury yield curve is positively sloped beginning at 2 years and fell slightly last week. The Chicago Fed’s National Financial Conditions Index (NFCI), which provides a comprehensive weekly update on U.S. financial conditions in money markets, debt and equity markets, and the traditional and “shadow” banking systems, showed loose financial conditions.
Real estate prices continue to rise. The Case-Shiller U.S. National Home Price Index is at an all-time high, double the level in 2006 just before the real estate bubble popped.
The Atlanta Fed’s GDPNow model estimate for real GDP growth (seasonally adjusted annual rate) in the second quarter of 2025 was 2.9 percent on June 27. This is a strong economic reading.
When the price of all assets are rising together (stocks, bonds, real estate) not to mention speculative investments like meme coins and SPACs it’s a sign that too much money is burning a hole in investors’ pockets. M2 is at near a record high and still growing.
Initial unemployment claims are in a very gradually increasing trend but still low. Ditto U-6 unemployment which includes the broadest measure of unemployment ( Total Unemployed, Plus All Persons Marginally Attached to the Labor Force, Plus Total Employed Part Time for Economic Reasons, as a Percent of the Civilian Labor Force Plus All Persons Marginally Attached to the Labor Force).
YOY inflation is above the Fed’s target. The options market expects a 0.25% fed funds rate cut in September but there’s nothing in the data that would indicate this is needed.
The impact of the Trump tariffs is still in the future. It’s almost July. The orders for the Christmas season will be placed soon for shipment over the next few months. That’s when inflation due to tariffs will begin to bite.
I think it’s truly amazing that the markets have absorbed so many shocks recently and bounced back. Will the bubbles continue to inflate? Only time will tell.
The METAR for next week is sunny.
Wendy
https://www.cmegroup.com/markets/interest-rates/cme-fedwatch-tool.html

