Wanted to share an interesting discussion on IBD Live on Friday. They always have a guest on Friday and this last week was Eric Krull of The Lifecycle Trade. He discussed his evaluation of stock market rallies. He looked at rallies using IBD Rally Day, FTD, DD, etc to determine (although didn’t outline exact start/stop criteria but assumably was percent gain and loss. Grouped Indexes in categories: Whipsaws, Small Losses Or Gains (SLOGs), Money Makers and Life Changers.
He has looked at the current rally and how it compares to the averages for each of his groupings.
He’s not a doom-sayer, but is advocating being cautious given the gain and duration of the current market. Certainly can go on much further, but could also be reaching some exhaustion. We are at day 56 of the rally and that puts us at greater than about 80% of previous rallies. We hit 90% of previous rally durations at 90 days. Plus, we are headed into earnings again soon. Again, he advocates for caution and making sure your plays are well founded.
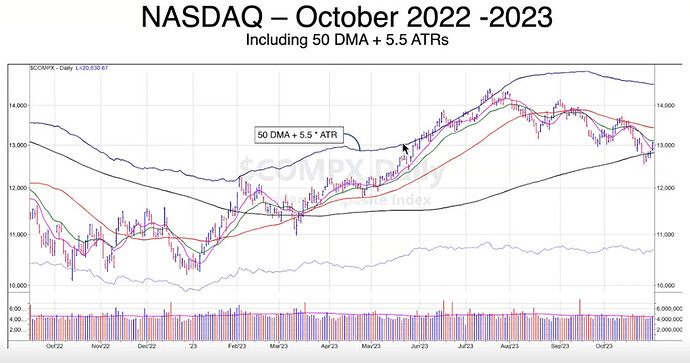
Here’s one thing I found particularly interesting. He, like many others and IBD, pay attention to the “distance” the index has moved about moving averages such as 21 or 50 sma’s. He has come up with using the 50 daily MA plus (ATR x 5.5) as a calculated line that tends to serve as a ceiling for indexes, at least the NASDAQ as in the noted graph below. Note: I did not catch the ATR duration but assumed 14 days as typical.
He extended the duration out some and gave further examples:
He stressed this is not an absolute, but when it “hits this guardrail” he is more inclined to consider hedging or taking profits. Likewise, if it pulls back from the “rail” and he’s watching a stock that is showing signs of a rally, he is more likely to be more aggressive.
Finally, he makes reference to a seasonality study he has done and refers to this time as the “Back to School Sale” time.
Short summation is that the market is often in or goes into a rally after June 1, but virtually always has corrected below the 50 DMA by September 1st. At least 26 of the last 27 years. I have not personally verified these numbers, yet. But find it interesting. His theory is that with the new batch of kids going to college, a lot of folks are tapping their investments to pay for such and that stimulates the dip. Hence teh name. We’re currently roughly 6.5% above the 50 dma, for the record.
The only thing absolute about this data is that I have not looked at the numbers specifically myself, so I am not confirming this data as absolute, just putting it out there for discussion and interest. Nor is he advocating to sell everything and hunker down. He’s urging caution and look critically at your positions as things move, and he only wants “perfect” plays for any new positions at this time. He leans towards hedging or taking profits if a position gets shaky.
IBD has segmented several of these type of discussions from IBD Live and stuck them out there as individual YouTube clips, maybe they’ll do that with this one. I just find it interesting and I appreciate playing with the data that helps provide perspective. But, as always, you do you.
Haven’t had time to check out his website, but plan to. Sure he wouldn’t mind the traffic.
Lakedog


