The long, long bull market since 2009 has finally matured into a fully-fledged epic bubble. Featuring extreme overvaluation, explosive price increases, frenzied issuance, and hysterically speculative investor behavior, I believe this event will be recorded as one of the great bubbles of financial history, right along with the South Sea bubble, 1929, and 2000.
These great bubbles are where fortunes are made and lost – and where investors truly prove their mettle. For positioning a portfolio to avoid the worst pain of a major bubble breaking is likely the most difficult part. Every career incentive in the industry and every fault of individual human psychology will work toward sucking investors in.
But this bubble will burst in due time, no matter how hard the Fed tries to support it, with consequent damaging effects on the economy and on portfolios. Make no mistake – for the majority of investors today, this could very well be the most important event of your investing lives. Speaking as an old student and historian of markets, it is intellectually exciting and terrifying at the same time. It is a privilege to ride through a market like this one more time.
The prediction was made on Jan-05-2021, since then SPY is up 82%, QQQ is up 96%…
There are lot of people trying to predict bubble… even if you are directionally correct, if you are off by time.. you are missing significant gains.. and in this particular case, even if markets goes down by 30%, 40%, still investor would have made more money by being in the market than getting out.
Separately, I hold John Hussman as a poster boy for someone who can write well, and gloom and doom sells but their record is losing 50% money in this bull market...
Grantham & Hussman are looking at numbers but ignoring paradigm shifts. When I started at IBM in 1960 Venezuela had about seven computers most in oil companies, a couple in government and one in private enterprise. A year later I visited IBM in NYC and was astounded to find more computers in a single office, 25 if I recall correctly. How many computers are there world wide today?
There was a paradigm shift in economics that few on Wall Street seem to think about, the Industrial Revolution perfected the Decreasing Returns Economy while the Data Revolution introduced the Increasing Returns Economy.
While the Decreasing Returns Economy benefits from technologies like automation every unit made costs about the same. In the Increasing Returns Economy the first unit costs a fortune but additional units are practically free, just the cost of downloading the app paid in large part by the buyer. Apple does not even have to develop most of the apps, they are created by an army of private coders.
Can we date the paradigm shift?
1984 IBM releases the IBM PC
1991 Tim Berners-Lee invents HTML
1998 Google launches the search engine
2007 Steve Jobs unveils the iPhone
During that quarter century the paradigm shifted from Decreasing to Increasing Returns. Can we see it on stock market charts? Pay attention to the various growth rates.
Dow Jones DJIA
30 years
Current CAGR: 7.2%
Average CAGR: 7.4%
For unrelated reasons the market crashed in 2007-8 just when Jobs was unveiling the iPhone. The paradigm shift is not noticeable in the hand picked DJIA 30 stock chart but very noticeable in the S&P-500 chart and more pronounced in the “tech heavy” NASDAQ chart, tech benefitting more from Increasing Returns than traditional industry.
The S&P 500 is up more than 20-fold over the past 30 years. That’s a 20-fold return while holding through a 50% decline in 2000 and another 50% decline in 2008.
I plan on holding through the next 50% decline, too.
Jason Zweig’s column in the WSJ today explains. Long Term Buy & Hold and " Minimize the Skim"
Let’s be clear, we’re in an AI bubble. Just like the dot com bubble, not all companies will go tats up, but many certainly will. It’s not just about timing, it’s also about investing in companies that will weather the upcoming storm. Here’s a post from January 2024. Somewhat dated, but still relevant -
This is just the Pareto Distribution at work but it does not make it a bubble which is a reference to the stock market. Look at the charts I posted and tell me today looks like the dot-com days.
You were so certain, but you don’t know how to define a bubble or provide data points why you think we are in bubble.
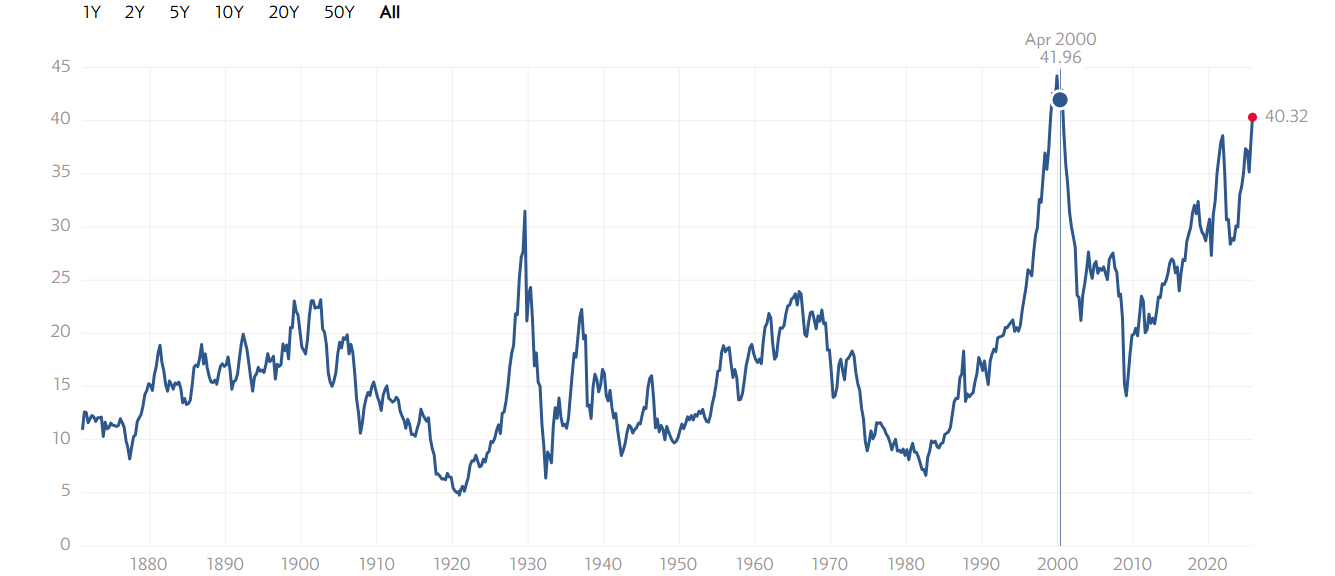
We are not living in sky-high valuations like 200 PE; While some look at CAPE, but forward earnings estimates are good, i.e., FWD PE’s are still reasonable.
During dot com era, unproven thesis like webvan was able to raise huge sum’s. Only proven AI companies are raising cash now.
There are concerns on circular-financing and significant new debt created are related to AI - Agreed
Profitability, ROI, $NVDA uses AI significantly and they are extremely profitable. Even $PLTR which has a very stretched valuation is pretty profitable and its customer base is government and enterprises, not companies chasing eyeballs…
If we cannot define, and measure, it is just hunch. With hunch, you cannot be so certain.
Here is an example… $JPM spends $2 Billion annually on AI and they are making that in savings and it is just tip of the iceberg…
“We know that it’s got to billions of cost savings and I think it’s the tip of the iceberg, .. bank already has hundreds of use cases for the emerging technology, and that applications will only continue to grow.” Dimon said
When you have a strong belief, often our minds refuse to see evidence to the contrary.
The artificial-intelligence boom has ushered in one of the costliest building sprees in world history. Over the past three years, leading tech firms have committed more toward AI data centers like the one in Ellendale, plus chips and energy, than it cost to build the interstate highway system over four decades,
Flooded with money from Wall Street and private-equity investors, it has metamorphosed into a computing goliath with a market value bigger than General Motors or Target.
Chips in an AI center have a useful life of between 3-5 years before they are outdated.
[This is my favorite:] This week, consultants at Bain & Co. estimated the wave of AI infrastructure spending will require $2 trillion in annual AI revenue by 2030. By comparison, that is more than the combined 2024 revenue of Amazon, Apple, Alphabet, Microsoft, Meta and Nvidia, and more than five times the size of the entire global subscription software market.
[Much of the story is on the fragility of CoreWeave, which leases data centers for up to 10 years, but whose clients only sign use leases for 2-5 years. If/when there’s weakness, this could be a problem?] = “If the wave of building proves far more than needed, or if tech companies pivot away from third-party providers, the risk is that CoreWeave’s data centers could end up like the dormant fiber optic cables that snaked through the U.S. in the 2000s.”
I have already posted how management consulting companies like McKinsey and Bain are not getting their share of consulting revenue in this “AI deployment” cycle.
Let us go to the source to get certain facts clear…
By 2030, technology executives will be faced with the challenge of deploying about $500 billion in capital expenditures and finding about $2 trillion in new revenue to profitably meet demand.
by 2030, global incremental AI compute requirements could reach 200 gigawatts
i.e, the demand is robust and going to grow… to meet that demand you need 200 GW capacity
Even if companies in the US shifted all.. IT budgets to cloud and reinvested the savings …into capital spending on new data centers, the amount would still fall short of the revenue needed to fund the full investment
i.e., there is not enough revenue to fund the cap-ex build to meet the demand
SO all Bain is saying is there is a huge demand, to meet that demand you need 200 GW capacity, current installed capacity in US is about 50+GW, so you need 4 x of current capacity…
To build that capacity, it will cost $500 B, to make $500 B profit, you need $2 Trillion in revenue, even if you account for AI savings you still need additional $800 B revenue.
So they are not saying there is huge demand, and the AI profits/ savings for companies are not sufficient to meet the cap-ex required to meet the demand. All they are doing is fear-mongering the boards, to talk to us so that we can help you/ companies bridge that gap.
This report is not saying there is a bubble… actually they are projecting not enough capital is raised to meet 200 GW capacity build… opposite to what you are saying…
I’m still here, didn’t get raptured today. I am fairly certain! When asset prices go up sharply due to FOMO, instead of actual demand…we’re in a bubble. When FOMO turns to panic, pop goes the bubble. Here are some reasons I believe we’re in an AI bubble:
Capex spending is off the charts, and off the books. Many of the hyperscaler AI companies are hiding their capex spending in creative accounting practices through SPVs and amortization wizardry. Reported spending is shocking - what’s unknown adds under the table risk.
The circle jerk cross investment between many AI juggernauts is a sure sign that capital is drying up. What’s also concerning is how much capital is being sucked out of the rest of the economy.
Good golly, it’s easy to see how “When you have a strong belief, often our minds refuse to see evidence to the contrary”. I’m not so sure I’m the one burying my head in the sand.
How is this calculated? If a company successfully takes one AI project to production, then it is counted out? meaning they are no longer adopting, but already adopted and taken out of the list??
Nothing new here. These capex numbers were announced by the companies in 2024, and only incrementally added in few cases. For ex: $GOOGL announced that they will do $75 B capex in 2025 at 2024, that number moved up to $85 B, but didn’t double or anything… And $GOOGL share price was trading between $150~$175 for multiple months and moved up only after the DOJ case… not because of their capex announcement.
In the case of $AMZN, not now, but in Nov 2024 I wrote Capex is $AMZN moat… They key point is while $AMZN numbers look really big, but it is only $20 B more than their D&A… in other words, that is the new capex, and the rest is actually maintenance capex…
This is something that is a concern. But, companies like $NVDA, $GOOGL has invested in other AI startups for sometime. Everyone knows about their coreweave investment, and they were invested in OpenAI… but sure, the scale of the new investments are big and concerning.
This is why I called when $NVDA misses revenue, that’s when AI bubble will pop, because that will create a cascading effect…
You invest $2B in AI and you have $2B saving in your operational cost, i.e,. JPM has recovered their investment in year one… do you understand what ROI in such case?
Why stock market charts? The economy is a mix of measurable facts and emotions that cannot be directly measured. I see stock market charts as the indicator of market related emotions.