They seem like a good choice for todays market. The yield goes up as rates go up, and the loans are secured loans.
Thoughts?
They seem like a good choice for todays market. The yield goes up as rates go up, and the loans are secured loans.
Thoughts?
This might have been a good idea a while back.
But over the last few years, a lot of investors were thinking this. Too many.
So the financial system got into gear and created a lot of smelly sausage financial products to meet the demand.
In short, they are stuffed to the gills with loans that will default.
Companies that no sane person would lend to were offered loans at very low rates, provided they agreed to a floating rate.
They said yes…why not? Rates were low!
And the lenders said yes, because they were all being packaged up and sold on. This sounds familiar…
Collateralized loan obligations, which is what they generally are, might be in the category of meeting the maxim:
What the wise man does in the beginning, the fool does in the end.
With all their problems, equities are still the better bet.
Imagine a monkey picking stocks by throwing darts at a dartboard covered with tickers–
but only the tickers of stocks with current earnings yields over 6% are on the board.
How well will the monkey do compared to a really smart bond investor?
Better, for sure.
In the VL set, that’s about 35% of stocks ranked by current earnings yield.
So far this century that monkey would have beat the S&P 500 by 6.89%/year, plus or minus statistical noise declining with the number of darts thrown.
Jim
Thanks.
Thanks.
You’re welcome.
But bear in mind I’m just some random guy on the internet.
Sometimes I’m wrong, sometimes spectacularly so.
I once recommended Lehman not long before the credit crunch…
https://discussion.fool.com/capital-markets-stocks-season-again-…
Jim
In the VL set, that’s about 35% of stocks ranked by current earnings yield.
So far this century that monkey would have beat the S&P 500 by 6.89%/year, plus or minus statistical noise declining with the number of darts thrown.
Would adding ROE or other to this had given either better results?
But over the last few years, a lot of investors were thinking this. Too many.
So the financial system got into gear and created a lot of smelly sausage financial products to meet the demand.
In short, they are stuffed to the gills with loans that will default.
Day-yam. I didn’t think of it this way. Urk, need to see where I hold any of these.
I once recommended Lehman not long before the credit crunch…
Another Jim (Cramer) recommended Bear Sterns. Which I bought, because it was sure to bounce back.
In the VL set, that’s about 35% of stocks ranked by current earnings yield.
So far this century that monkey would have beat the S&P 500 by 6.89%/year, plus or minus statistical noise declining with the number of darts thrown.
-----------------------------------------------------------------------------------------------------
Would adding ROE or other to this had given either better results?
Sure.
This is the MI board after all : )
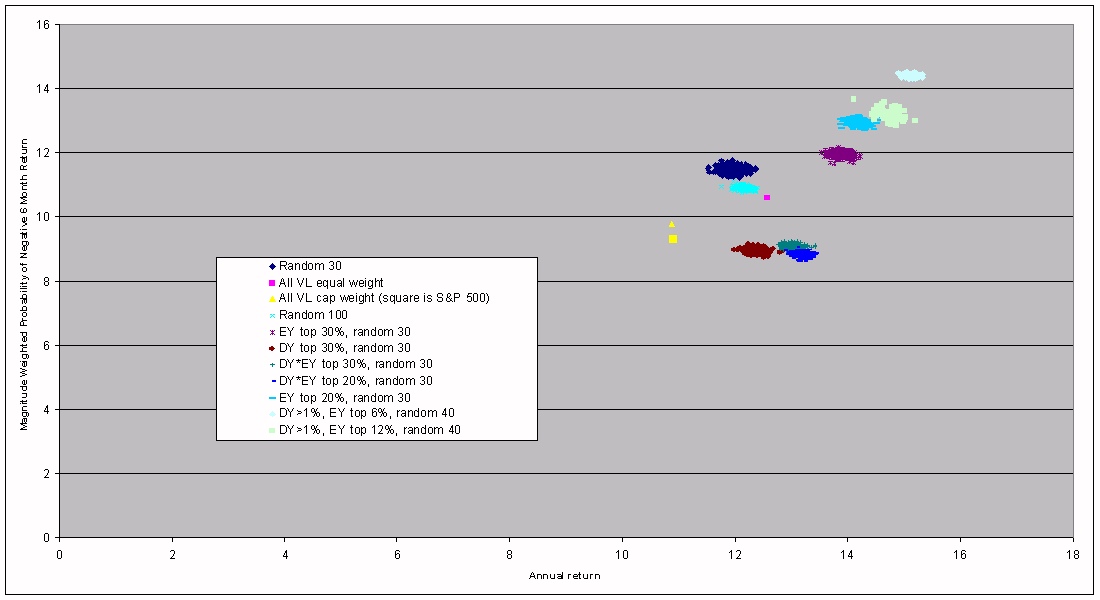
Here is a scatter plot of a few monkey-with-a-dartboard strategies, done in 2014
http://stonewellfunds.com/Random.jpg
I do not guarantee perfection on that graph, by the way, but I no longer have the tools to reproduce it exactly.
But FWIW, the highest return strategy on the graph (pale blue, top right):
Start with all Value Line stocks with a dividend yield of at least 1% at the moment.
Of those, take the 6% with the highest earnings yield (lowest positive P/E).
Of those, buy 40 stocks at random. Hold for a year. Repeat.
The hard part is deciding at which point you are no longer a monkey with a dartboard and you are simply overmining the data.
That graph was done shortly before dividend stocks spend a few years being huge underperformers, for example.
My favourite simple starting point is high ROE.
e.g., the set of the 30% of VL stocks with highest ROE does nicely, so any decently sized dartboard set will do similarly.
Five year sales growth is also good.
But really, the old MI approach is probably better: add a final sort.
In effect, it’s saying that we can probably find a better final sort than a random shuffle.
A 50-stock SOS of [100 highest ROE VL stocks] and [100 highest 5-year-sales-growth VL stocks] beat the S&P by about 7.5%/year since 1997, with lower downdev risk.
Assumes quarterly holds with friction.
What I like about that approach is: how bad could it be? Worst case you’re probably a closet tracker spending a bit on trading costs.
(which would no doubt still beat most investors)
With 50 stocks you aren’t going to do badly due to a single blowup or a momentary concentration in an about-to-explode industry.
Every stock has a good return on equity and good sales growth–you might not outperform, but it’s hard to see those being worse than average picks over time.
Jim
In the VL set, that’s about 35% of stocks ranked by current earnings yield.
So far this century that monkey would have beat the S&P 500 by 6.89%/year, plus or minus statistical noise declining with the number of darts thrown.
-----------------------------------------------------------------------------------------------------
Would adding ROE or other to this had given either better results?
You could, but those two are similar measures. Both are earning ratios. Earnings yield divides total earnings by market cap. ROE divides total earnings by total equity as reported on the balance sheet. The ratio of these two measures is the price to book ratio.
Elan
You could, but those two are similar measures. Both are earning ratios. Earnings yield divides total
earnings by market cap. ROE divides total earnings by total equity as reported on the balance sheet.
They have a factor in common, but they are measuring very different things.
One, the ROE, attempts to measure how attractive the underlying business seems to be in terms of its economics.
A high return on equity (or return on assets), especially if not falling on trend, is a sign that a company has a business with pricing power.
If a competitor could reproduce the assets and compete with you, they would–they would get a high return on the money they put up.
But as they haven’t done so, there is probably something preventing them. An economic moat, in the parlance.
Their clients appear to believe that the company’s product or service has no close substitute: definitely a good thing for shareholders.
But that business could be either expensive or cheap at the moment.
The earnings yield is an attempt to decide which it is.
As the two metrics are so different, it’s possible to have any combination:
good cheap business, bad cheap business, good expensive business, bad expensive business.
By looking at both, you can try to find the stuff that’s both good and cheap.
One metric is no substitute for the other.
An interesting corollary: if two firms have comparable earnings yields, the one with the high ROE is definitely the one to go for.
As you note, this is tied in with price-to-book. The better firm will have fewer assets needed to
produce the same earnings, so if they’re at the same earnings yield it will have the higher P/B ratio.
This is the reason that looking for a low P/B firm as an attempt to get “cheap” stocks doesn’t work:
more often it is simply finding poor quality businesses that require the most assets to produce a dollar of earnings.
These are on average the businesses most exposed to head-to-head competition and lacking in pricing power.
Plus, they generally need lots of new capital in order to expand, leading to debt or dilution.
The fact that low P/B doesn’t work as a way to outperform is the reason that most “value” indexes don’t work.
They are looking more for bad businesses than for companies offering a lot of value for the price.
Some look for low growth rates too. They should be called “dud” indexes, not “value” indexes.
If you’re going to skip one of the two tests, ROE works surprisingly well on its own.
Arguably you do better with a good business not checking to see if it’s expensive than you do with a cheap business not checking to see if it’s good.
But it’s good not to get sucked in by a firm with too much leverage. That can boost ROE but create dire levels of fragility.
When looking at individual firms I don’t look at ROE without first looking at the gearing, e.g. earnings to debt ratio.
Jim
Just out of curiosity and because “free is good”
https://research.valueline.com/screener/stock
Settings
% Return on Shareholders Equity
Sales Growth 5 Yr
Do these stocks align with the paid screener and conceptually is the above a “good” approximation of this screen?
Settings
% Return on Shareholders Equity…
I think I’d try something like this;
(1) Market cap over 2200m, to give around 1700 stocks, the size of the “standard” VL database
(2) Dividend yield over .01%, to make sure there is one.
(3) Shareholders’ equity, whatever cutoff gets you around 280 stocks, around 22% these days
My screen gives an average of 280 stocks at this stage.
Hmmm…there are no fields for the cash or debt.
But, they do have ratio of long term debt to total capital.
So, maybe set that to whatever figure leaves around 40 stocks.
From their most negative number to a maximum of 25% seems to work.
That gives these tickers, don’t know if they’re any good
AAP ACN AOS BCC CHE CSCO DHI EOG ERIE EVR FAST
FHI FL FNF GGG GIL INTU JBHT JKHY LSTR MATX MKSI
MLI MT NVO ODFL PAYX PFSI RIO RMD ROL RS SEIC
SIG TER TSM TXRH UFPI VOYA WFG WSO WWE
Problem is, I’m not sure if their negative debt-to-equity jmeans they have less-than-zero debt (cash?) or means they have negative equity (more likely).
Negative equity is good if a firm has earnings last year and next year, but not really in general.
So maybe you need debt-to-equity from 0 to 26.
That gives these tickers–
AAP ACN AOS BCC CHE CSCO DHI EOG ERIE EVR FAST
FHI FL FNF GGG GIL HUN INTC INTU JBHT JKHY LSTR
MATX MKSI MLI MT NVO ODFL PAG PAYX PFSI RIO RMD
ROL RS SEIC SIG TER TSM TXRH UFPI VOYA WFG WSO WWE
Jim
But, they do have ratio of long term debt to total capital.
So, maybe set that to whatever figure leaves around 40 stocks.
From their most negative number to a maximum of 25% seems to work.
Problem is, I’m not sure if their negative debt-to-equity jmeans they have less-than-zero debt (cash?) or means they have negative equity (more likely).
Are you looking for firms with high debt or low debt? How can the ratio of debt to capital be negative? How can there be less than zero debt? I guess I’m confused.
Elan
How can there be less than zero debt? I guess I’m confused.
Me too.
At first I assumed negative debt: they were taking net cash as the figure, so the sort order would make sense.
But much more likely is that they were taking the ratio of debt to shareholder’s equity.
Shareholder’s equity can be negative, so you get some weird negative ratios arising from [positive debt]/[negative equity].
The sort order is…not obviously meaningful.
Sidebar:
It might not be obvious, but negative equity can be a very good sign.
Some firms have such an “infinite ROE” that they don’t need any net assets at all to make a profit.
But it is a useful observation only among those firms with negative equity which are consistently profitable.
Maybe they have debt, meaning they have gross assets to make their money if not net assets, but the people lending to them don’t see a problem with that.
Within VL, a portfolio of all the stocks with negative book, positive TTM EPS, and positive “current EPS” had no negative calendar years since 2009 and beat the S&P handily.
Before that too, but there weren’t enough to make a meaningful sample.
VL reports the ROE for these firms as negative. So, the good investments are the ones with ROE negative or very high, but not low positive numbers.
Jim
Just out of curiosity and because “free is good”
https://research.valueline.com/screener/stock
Thanks! That link saves me a 60 mile drive to the nearest library that has a VL subscription.