Andy, lots of excellent information, thanks for the work.
RE: tracking. Some smart guy at MF created a Google sheet that is pretty good at tracking. It is better at long term holdings, but still good. You enter the date, price and share count and it will track it against the S&P. It has a tab for current portfolio performance vs S&P. The weakness is when you sell (and it does not track cash). You move your sold items to a “sell” tab and that is not summarized. However, you can do some summations and figure out your total losses and losses vs S&P performance. I can post a link if anyone is interested. Also, what I like to do (at Fidelity), is create a completely different account for my IBD funds (and my SimonSez) funds. So, I just create a new IRA account then transfer in cash in a nice round number (I am OCD) and let the account show me the total return over time (absolute and vs S&P). But I do mess it up, I sometimes go on “virtual” margin when I am out of cash in my IBD account. I will buy an IBD stock in my main IRA or Roth IRA, so those can only be tracked well in the spreadsheet.
Here is my record YTD for the stocks purchased in my IBD account and not with “virtual margin”.

RE: holding. Of those noted, I currently only hold NVDA in my IBD account.

So what I think of NVDA has to be in context of my holdings and profit margin. If I had bought all these shares during the current breakout, it would have been at the gap up day, which was above the 5% buy zone. That is ok to do on a gap-up, but my basis would have been way higher. In that context, maybe I would have sold all shares after the ugly downside reversal day. As a side note: I have to be psychologically cool with buying back a great stock when the facts change. So if I sold quick, I would be looking to see strong support and an upside reversal from the 21dema.
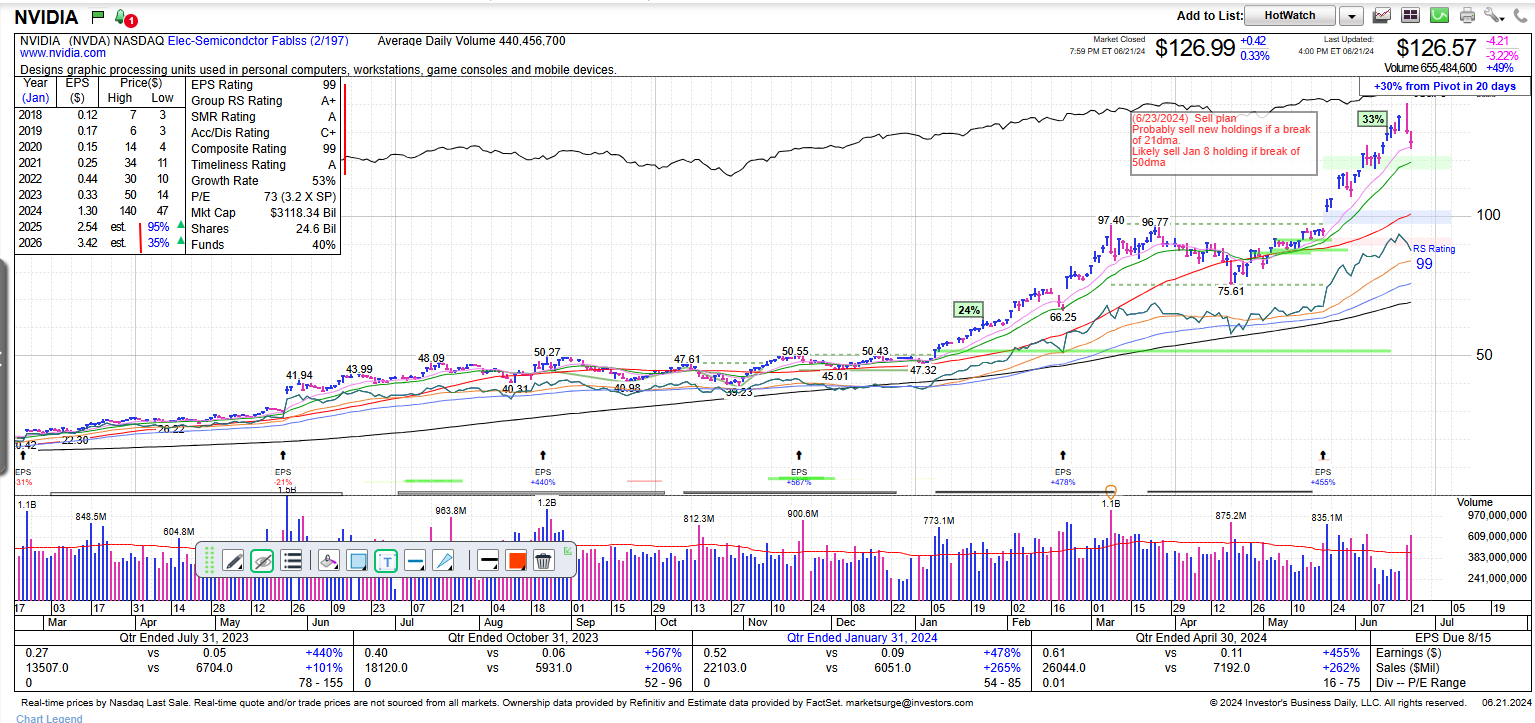
But, as you can see from the data and the chart below, I have some shares I bought on the Jan 8 breakout. You can see all the ups and downs I was willing to ride out because it went from $50 to $75 before its first test of the 21dma. Then I was able to hold through that base that started in March. You can see from my green horizontal lines that I was buying this stock before the breakout of that Stage 2 base. This was partially because I had a huge profit in a current IBD position, and partially because IBD team always talks about early buy opportunities so I try finding those and buying smaller positions while waiting for a breakout.
So here we are now, what do we do. An IBD position trader is NOT trying to catch a falling knife, this is the wrong place to buy. But what do I do? My most likely move now is to sell half of those new positions I bought early in back in May, or maybe I will do that if the 21dma does not hold. Not 100% sure as I write this. NVDA and the Naz are extended. IBD exposure is set to 80-100% and they talk about being closer to 80%, so I should have some cash (I did sell my weakest holdings already).
Notice that I am trying to form the habit of writing a “sell plan” note on my charts, that reminds me every time I look so I don’t get caught off guard or forget my discipline.
If you look at SS3 OHLC chart, it seems better than IBD. You would have been in for all the gains and out for all of the losses. It seems like using those price labels is foolproof. Just not sure it can be.
Hopefully this was not too long and incoherent, I didn’t have time to write a shorter one.
Pete