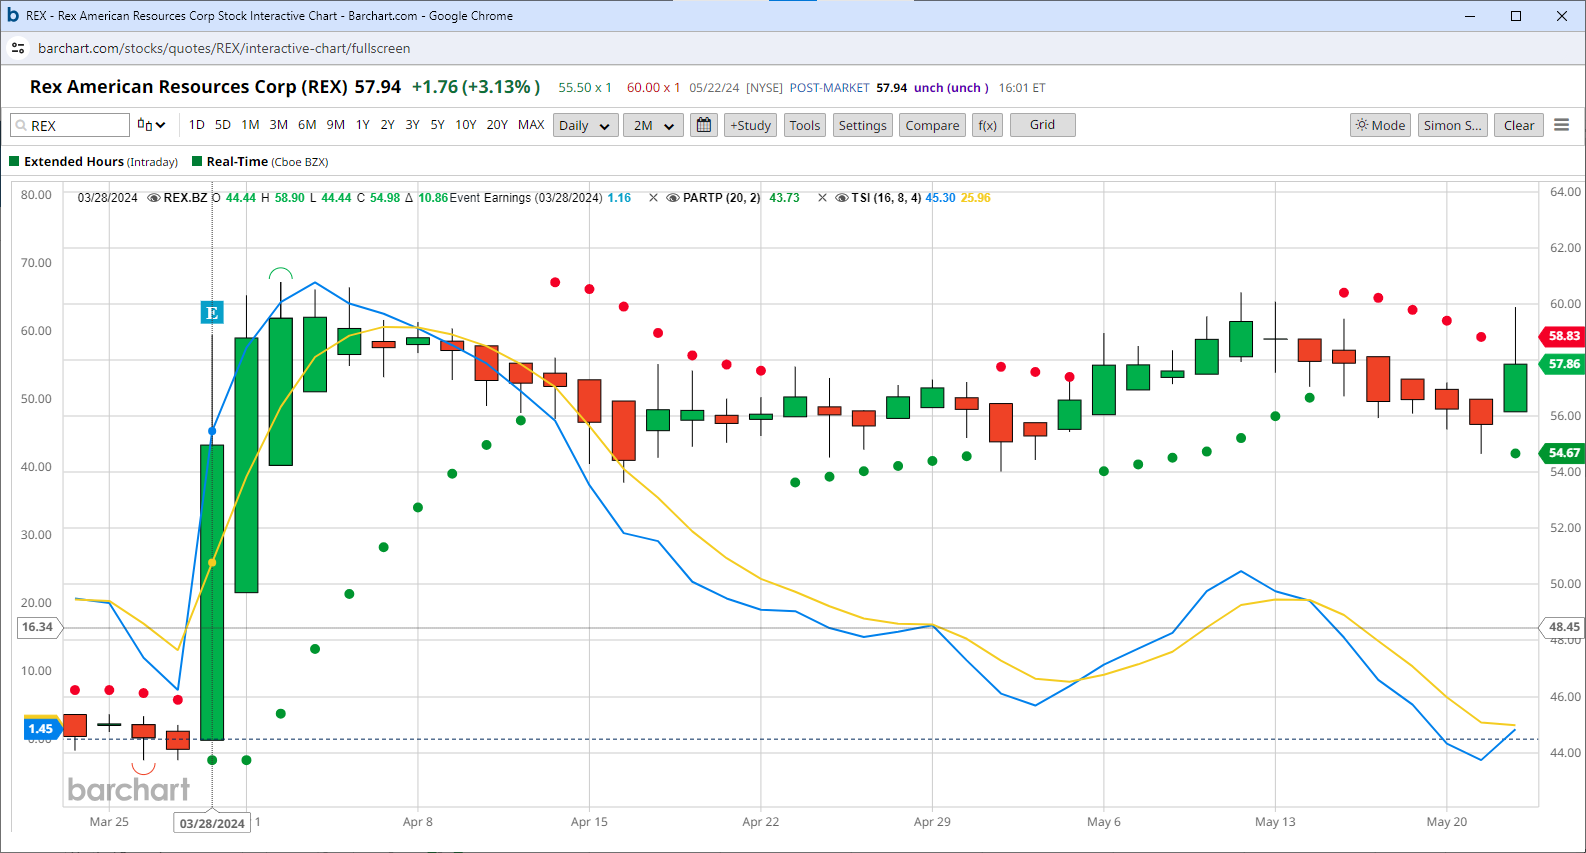
I am posting this as a good example of the difficulty of a sell decision. I bought $REX on a great earnings gap, but after letting it settle a bit. As it bounced around going mostly sideways I kept adding. MarketSurge detected a new flat base. But the stock started drifting too low for my comfort and I did want to raise a little cash before NVDA earnings. Also, its own earnings were due and I did not have a sufficient profit margin to cushion me. So, here is the chart. The green lines mark my buy points and the red annotation is where I sold. After the chart image, I put my journal thoughts which include a little post-analysis. I would be interested in analysis feedback from any who are interested. I don’t think I made a big dumb mistake, but a bunch of little mistakes can add up too.
4/17/24: Added 1/3 position. It has come in since huge earnings gap, but market has become weaker. I am thinking the earnings were so strong, this pullback will be a good opportunity.
5/3/24: (4/26 felt like FTD and so did 5/3) added 1/6th position. 21dma has been providing good support.
5/6/24: added 1/6th. Assumption is that the gap up was so strong it will not be revisited.
5/9/24: added 1/6th, total or 5/6th of a position.
5/21/24: Sold all, thought I might find better opportunities after NVDA earnings. Also, REX earnings are out tomorrow. I did sell this at the exact bottom and it bounce back to positive by end of day.
5/22/24: Earnings were decent so stock is up 6% on +131% volume. Was I right to sell? The stock never hit the 50dma. My notes said my expectation was that it would not revisit the gap, and it did not, so why sell? The stock did not even revisit the bottom of the current base. The down days were not on high volume. It was forming a handle on this new base, handles are formed by weak sellers getting out, guess that was me. Should I buy this back? It would be ok to take an early buy not that earnings caused a decent move up and an move that broke a down-trend line. I bought ALKT back and that worked but for now I will hold cash through NVDA earnings. It is easy to judge in retrospect, but, the only strong reason to sell was that we were coming into earnings.
@buynholdisdead
RE: VITL: all the numbers look great. The proper buy point in my mind was the fade after the gap up on earnings. This is not just looking back and seeing the current results, we keep seeing big gap ups, with a short give back then a good move up. Can it be bought now, I guess I would be reticent to do that, but I can’t tell you it won’t keep going on those continued strong numbers. I have an emotional bias against Vital Farms, MF recommended it (2022?) and I railed against it and thought it was bad rec. I did not think there was any barrier to entry, I had been buying pastured hen eggs for years before that and I noticed prices for little farms like “Nellies” were way cheaper than Vital, so I did not think the would make good money. Today I looked in the Publix here in Sarasota and they were $8.50 for a dozen pastured eggs. I got a different brand on sale for $3.50 the other week and Trader Joe’s has pasture raised hen eggs for $4.50 all the time. I just don’t see how the do it, but clearly I am wrong!
RE: WING. Yes, they had a 3-weeks-tight pattern. IBD dogma is that this is an add-on pattern for existing holdings and you would add about 10% of your cost basis on a break above this pattern. The same is true for the first one or two tests of the 50dma (or 10week) after a breakout, just a small add to existing. So, IBD would say, you can’t establish a full position at this time, it does not follow the rules. I too have been Jonesing for a position in WING and BROS, but I don’t want to buy WING here. On the other hand, BROS had a good gap up and then breakout on earnings, now it is revisiting the buy point and that could be a good place to buy. I will probably talk myself into doing that. Notice the decrease in selling volume as it is forming that “handle” or retracement to the buy point. Bill said 40% of breakouts retrace to the buy point, so you can’t think it is bad for that to happen.
“I would be interested in analysis feedback from any who are interested. I don’t think I made a big dumb mistake, but a bunch of little mistakes can add up too.”
Pete,
John Murphy argues that FA + TA = RA (Rational Analysis), and I wouldn’t disagree. But the problem them who favor fundamental analysis as the primary basis on which to make buy/sell decisions is they often force technical charts into saying what they’re hoping will come true instead of seeing what is actually happening.
Your entry into REX on 4/17 lacked technical motivation, and it should NOT have been done. (IMHO, 'natch.) OTOH, had you been tracking REX closely, you could have risked getting in a month earlier around March 18 and would have made a killing in the earnings gap up.
Yeah, yeah. Woulda, coulda. But that’s the trading game. Positions need to be put on BEFORE the price jumps happen, not afterwards when the expectation should be profit-taking and a return of prices to previous lower levels.
I can see why you did all your buys Pete and I can’t fault you on your decisions because they were well reasoned. I think why you sold though is because you invested to much without any deep conviction. After your first buy I think I would have waited until they popped above the pivot point. That would have made the stock prove itself.
I don’t love the financials though so I probably would have never bought the stock. But if you look at the technicals it is forming a tight area on the weekly chart which normally means that institutions are buying it up. Then if you look at the fund report you see that the number of funds are climbing. So the Technicals all look really good. But, just my thoughts, there are much better stocks out there. Ones that have growing Revenues above 20 percent and earnings over 30 to 40 percent.
Oct to Jun, REX was in a trading range. When it broke above resistance and became a Stage Two stock, that’s when the initial buy should have been done.
On the pullback, the position should have been added to. Ditto the second pullback.
Once the second leg of the second Measured Move unfolded, an exit should have been planned, because the stock was now late Stage Three.
Hi Charlie,
You are correct but Pete is following Bill Oneill’s IBD Trading methods on this string. I am not sure how well it matches up with Weinstein’s method, Although I enjoyed Weinstein’s book also.
But if following the IBD method isn’t producing good results, such as was the case with REX, then why continue using it in the present market?
My guess is the IBD method depends on there being a bull market, which we don’t have. (We’ve got rising stock prices, but not a strong economy.) Also, why not employ a basket of investing/trading methods rather than just a single one and not jump in unless there is majority agreement among them?
Thanks all, good feedback, which in nice in a supportive learning community. From a longer term CANSLIM/IBD point of view. REX broke out from a Stage 1 base 5/25/23 (looks like a match with @arindam chart. The base did not advance 20% or more so the next base that set up was also a stage 1. The could be an add point for those that bought the firs time, or a new buy for anyone new. Once again, it did not rise +20% so the next base that started in late Aug 2023 was also a stage 1. That breakout in on an earnings gap up was an immediate 23% rise, but then retrace back below the official buy point. This causes more than an 8% loss from when someone could have bought it, so IBD rule is to sell. But, if you had bought the first breakout and/or the second you could have held. If you had added to those holdings, IBD sell rule says sell the new holdings if they lose 7-8%. That brings us to the 3//28/24 gap up on earnings which was a breakout, which is where I came in. I bought as the price doodled round much lower than the high of that gap day. I think my biggest mistake was continuing to add to create nearly a full position in the wrong place.
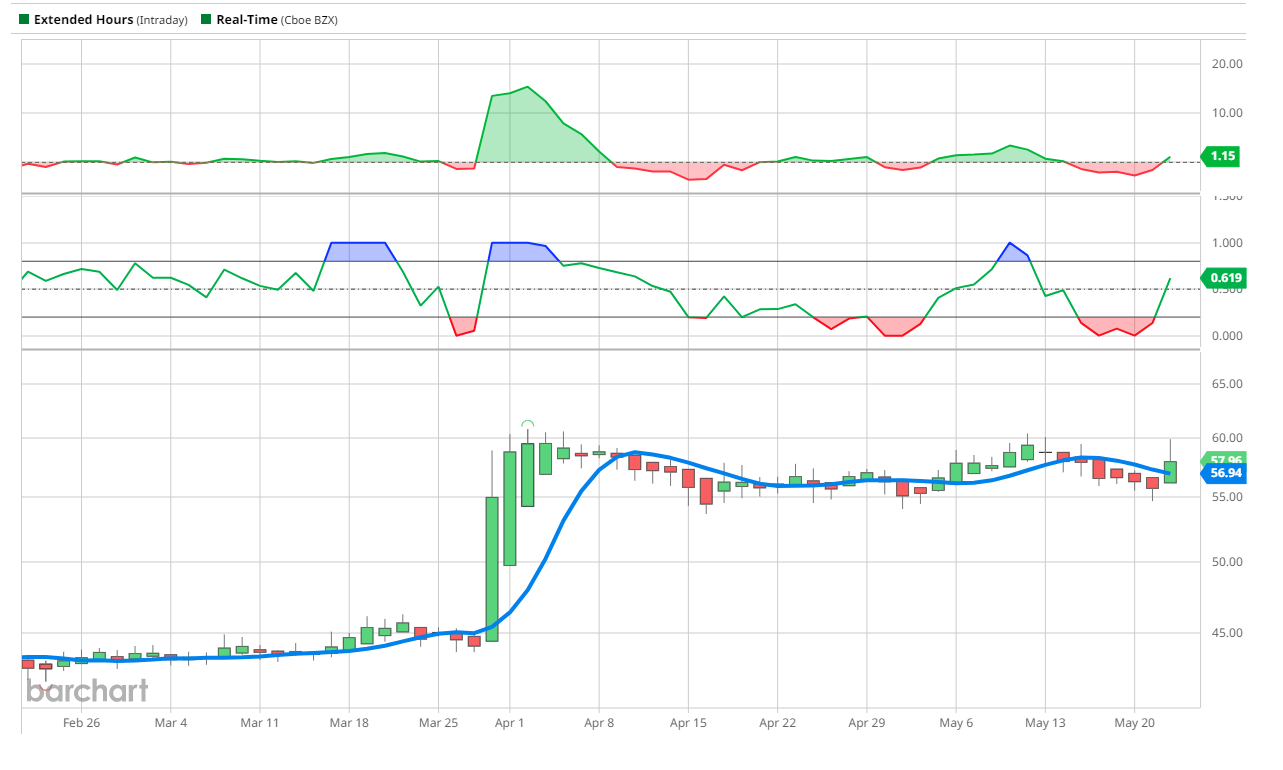
@buynholdisdead doesn’t like the fundamentals so much. I agree that the sales growth is bad if you look along the bottom table, Also, the 2025 estimates are bad, but they did surprise on the previous earnings. So yes, I should have demanded better fundamentals. Andy, can you post a SimonSez chart for last 2 months to see what it might have told me about taking a risk outside of a breakout opportunity.
I do want to note that I did an excellent job calling the bottom (or making it)
I agree with you Charlie but I don’t have the skills yet to see exactly what method is the best method to use at this time. I am trying to be flexible and looking at multiple systems. I was just explaining what system Pete was trying to emulate at this time. Thanks for your help, I do appreciate it.
With the simon sez chart I would have bought on 3/28 and then been out on 4/4. Follow the Yellow and blue lines. When blue above you buy when blue below you sell.
Pete. On the weekly charts of IBD for Elf I noticed that the Sales percent change was incorrect for the estimated quarterly numbers. When I called IBD they said they were switching data companies and the estimates are from a different company.
The Numbers all looked correct but they were calculating them incorrectly. The were calculating the estimated numbers first - the actual number / estimated numbers and it should be the other way around. Just to let you know. I reported it and they said they were working on it since a lot of people have reported it.
“…but I don’t have the skills yet to see exactly what method is the best method to use at this time.”
Andy,
I’d argue that looking for “the best” is a waste of time. What makes better sense is “good enough for the amount of work I’m willing to do and the risks I’m willing to accept.”
The essence of the IBD method is ‘momentum’ (aka, “growth”). An opposite method is ‘value’, (aka, "mean reversion’). Each has their time and place. People like Lynch tried to combine the two --GARP-- and did exceedingly well, but also had to work his b*tt off and later quit the game entirely for having missed too many of his kids’ birthdays, etc.
Right now, the present market is fragile for reasons that have been accumulating for a decade. Money can be made. But the bigger money will come from positioning oneself for the next big move. which is the inevitable crash that’s coming. (IMHO, natch.) That’s means practicing now to be nimble and being willing to adapt to changing market conditions.
Quill’s family of methods is really just one method. He’s buying short-term breakouts and selling short-term breakdowns. In short, he’s doing a technical version of value investing, aka, “Buy low. Sell High”.
@Arindam I have a different view of things. Who says the IBD method isn’t producing good results? Rex was an example, and maybe an example of sub-optimal decision making, but it was one of many investments. I am up 20% for the year, and would never expect to bat a thousand. Maybe Quill can and maybe I will learn how and switch. IBD recommend a concentrated portfolio of 5-10 stocks. That allows you to focus and forces you to get rid of poor performers if you want to add to strong performers or buy a new stock you think has potential. IBD/CANSLIM does “measure the market” and has rules to get you out so you are in cash for all major crashes. So if you just break even with the S&P in a bull market but are in cash during big crashes, you win. SimonSez will clearly get you out faster. TeeterTottering SimonSez gets you shorting in a down market. Maybe that is the magic system, but if it was, everyone on this board would be using it 100%.
So yes, IBD says only invest during a confirmed rally. They use follow-through-days to indicate when the market is in a confirmed rally. There was an FTD on 11/2/23, and recently IBD called a “market in correction” (But before that binary point, they had been updating their new “exposure” scale downwards so I was selling out as the market got weaker (all about probabilities). When the market started getting healthier, the started upping the exposure levels and Mike Webster called two “virtual FTDs” on days that just barely did not have the required volume (see other discussions). On 5/15/24, there was a day with sufficient up price and up volume to officially call a “Confirmed rally”
Here is their new approach to improved communication of reasonable exposure…
I also have to disagree with on you the economy, it is strong, in fact it is so strong the Fed will not lower rates. The job market is tight, there are 10 million job openings that can’t be filled. But that is irrelevant to the IBD system, they look at the strength of the market day-by-day. It is just that it is less likely you will get a “bull” market in a bad economy.
I did not create IBD, I am not married to it. I can be convinced that another method may work for me and my lifestyle. But right now, I am trying to become excellent at IBD because I love a challenge, and I think the system can do well once mastered.
If you like the IBD method --and I’ll freely it is appealing-- then stick with it.
I own several of O’Neil’s books, used to subscribe to IBD, and have attended some of their seminars. So I’m not unfamiliar with their program, their past results, and their implied future ones. It’s just that I prefer other methods, because I don’t share their optimistic assumptions.
By all metrics --other than assets prices goosed by easy money policies-- the US economy is weak, and the US empire is dying. E.g., half of all American household don’t even have enough savings to buy a set of new tires. So now it not the time I want to be getting long on companies whose products and services I never use and whose future I know is bleak. That’s a minority view. But that’s the way I’m structuring my financial activities. Others --of course-- see things differently and will act according.
" Charlie, When was the last time you were bullish on the economy?"
Probably when Clinton was president. Not because of his policies, but because he had inherited factors that contributed to a strong economy, such as a budget surplus and still affordable foreign follies.
Nowadays, our sovereign debt is unmanageable, and the deficit spending is getting worse. The $US dollar is being replaced as a settlement currency. That means hyperinflation will plague us. The US is no longer competitive commercially or militarily, or else it wouldn’t be trying to sanction the rest of the world. The American Century has ended.
The problem with economic forecasts is this. If one bets that all will be well, but it turns out not to be, then one is likely in deep trouble, as will be most American households. If one hedges the future, one might still suffer a lot of economic damage, but less so and probably sustainably so.
That’s the bet I’m making. Kids, house, car, and toys were long ago paid for, and my current incomes streams are 4x my current expenses. I have positioned myself to be able to suffer a lot of damage. That doesn’t describe the US economy, nor the average US household. This country is bankrupt. Its political system is broken. Until a cleansing crash happens, things are only going to get worse on the borders, in the inner cities, in the schools, etc.