I’m not into technical analysis. What are we looking at there?
I am no TA guru.
Instead I like to only know up from down. We are up. We are way up.
We have nibso so at the wheel driving. What could go wrong?
TIG is very naive on the idea of what could go wrong.
Tariffs don’t work. Interest rates won’t work.
I’d love to hear from my fellow fools what will work for this economy.
The brakes are being hit hard.
We get Wendy saying the markets have very high valuations. No one disagrees. Does not bode well.
JMO
The longs don’t what to hear that? Or they don’t know what to do with it.
Those are two fine looking charts!
DB2
Nice day to be long.
The days are numbered.
“To every thing there is a season, and a time to every purpose under the heaven…”
DB2
SPY 25 year chart.

QQQ 25 year chart.

BMW charts look at “mean reversion”.
2025 is the sliver way to the right side.
![]()
ralph
It is very rare to have two bear markets in one year. While the market is high, it can still go much higher. Nobody knows, and those who say they do are always wrong. It’s better to just follow the market and let it tell you “when” it is going down, instead of trying to guess. I like this chart where the horizontal red line shows resistance. If it drops below that, I will be getting bearish. That and the 50 sma line which is the lighter red line going vertical.

A couple more charts to look at. This one looks like we are ready for a mean conversion.

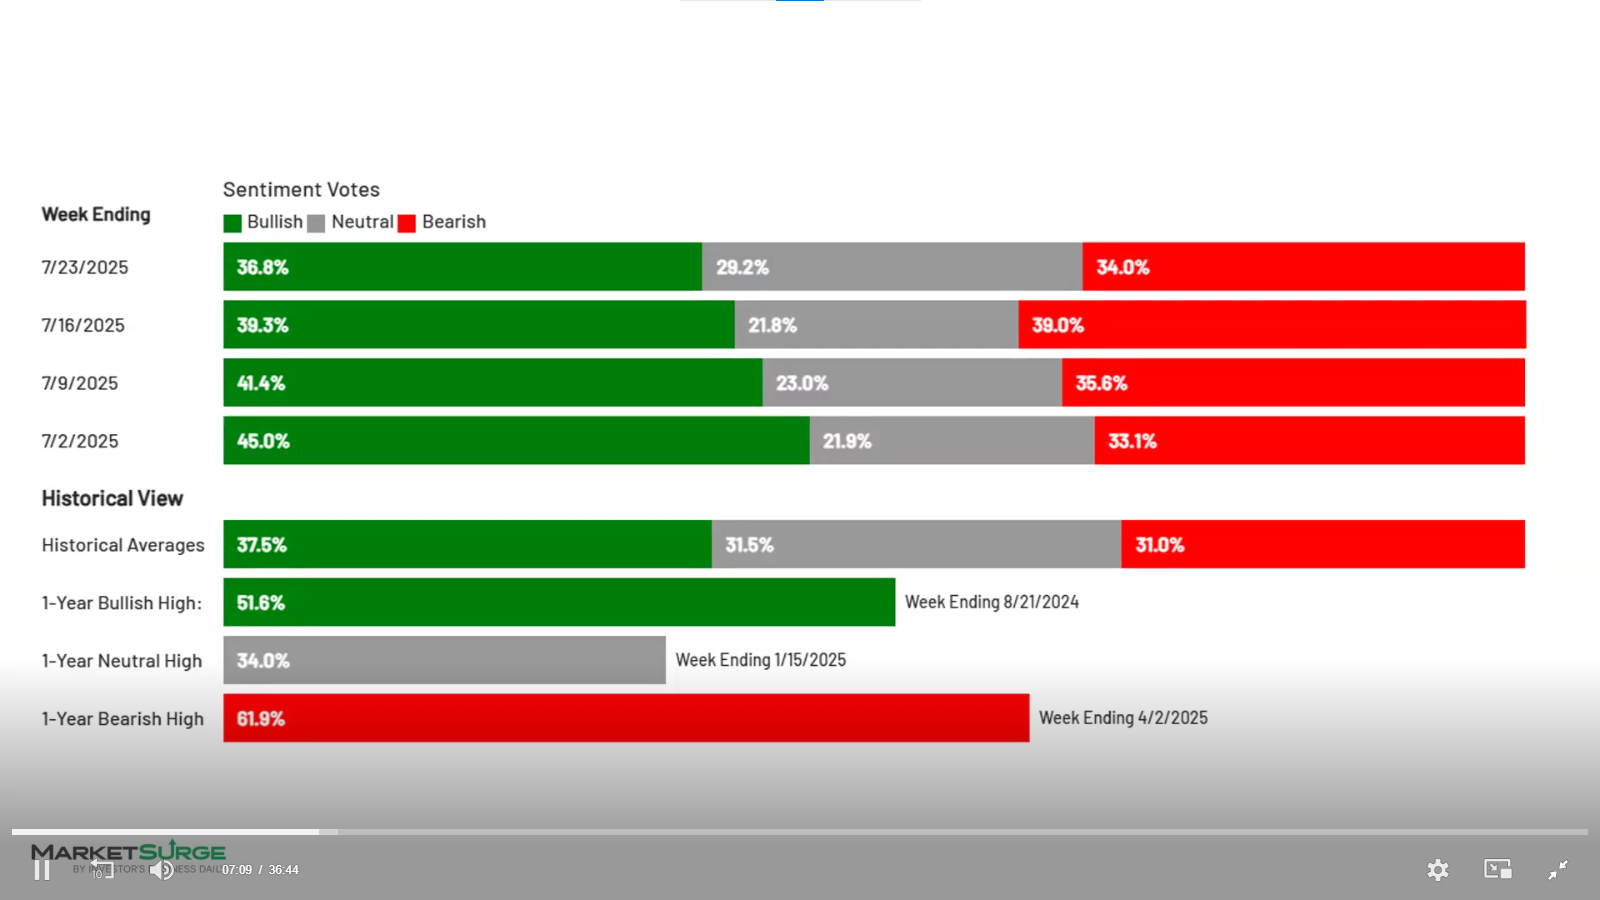
But if you look at this, we have just about as many bulls as bears. Hard to have a mean reversion when you do not have a majority Bulls.
Tig made money from bankruptcy. Remember him saying smart people go bankrupt? The debt looked sweet.
To every season…turn, turn…
Not trying to stir up anything particular with this but it’s a minor phenom’ I came across about 15 yrs ago and thought I’d revisit. I like to know, if the market is going to dump, just how far and for how long? IOW: What am I losing? Most recessions/corrections are non-events. I like knowing patterns.
I could only get datums going back to 1923. I looked for the most egregious corrections. I didn’t look for exact days or months.
The 2009 low lost you all the way back to about 1997
1974 lost you all the way back to early 1959
1942 lost you all the way back to about 1931
Before that I think the internals of the economy, the market, the government, and the whole “social infrastructure” were sufficiently different as to render comparisons unworthy.
So, it looks like every 30-35 years we have “The Big One.” A long term washout and major setback of about 12 or so years. I am aware that three whole data points is more of a parlor conversation thing and not real economics but thought it might be relevant to a bunch of people looking for stock market activity.
Moral of the story: We have a few more years but are encroaching on the 30-35 year window. If we were to have a crash of similar magnitude today we’d lose everything we haven’t worked hard for all these years, all the way back to…somewhere in the 1600 range of the SP500. At least.
Gee. I hope things will be different this time
UPDATE: WRONG! No we’re not encroaching on the 30 year window yet. As a theoretical mathematician I am unable to count or keep score at bowling. 2009 was closer to 20 years ago, not 30. Goody-woody! Maybe it won’t be so bad? But, Leap1 is correct below when he says the old guardrails are gone or going so, the skids might already be greased.
The new deal stability is gone
1890 - 1900
And
1920 - 1923
Might be better examples.
You might be right or… we could get back on track while there’s still time. In either case we’ll start reinventing that wheel.
Charts? We are doing charts?
Consider the ‚e-wave‘ chart someone posted a month ago. Critics would say e-wave is the art of retrofitting the ‚count’ to what the market actually did, without much if any predictive value. But it has something intellectually pleasing.
To oversimplify, five ways up are usually followed by a three wave down correction, most often by 38% or 50%.
According to the count below, we are just completing a five years up from the Covid lows in 2022, red numbers in brackets. Worse, that upwave is embedded (yes, they can nestle) in a larger (one order up) five waves up since the financial crisis low (black numbers). Worst, that upwave is again embedded in an even larger order five waves up since around 1980 (pink numbers).
All culminating in a five of five of five top over the next few weeks. Say tariffs, reversal of globalization, broad corruption, uncertainty, arbitrary decision-making, might-makes-right and wars are ushering us into a dystopian world.
Unless the market does something else and the count is retrofitted. Say the market fully realizes the boundless potential of AI, takes off and never looks back.

To get back on track we need to raise taxes.
It is odd but I think TIG will do that.
No buey Jose! Why do you think that?
I might agree with you if TFG started taking a cut of tax revenue.
It simply goes back to the way to grow our GDP. For all the mixed messages he is agnostic on taxes. Insisting on things one minute and doing whatever it takes the next often ruinous moment. I think TIG gets some things eventually right. No one is absolutely all or nothing wrong. He tries.
Data from Morgan Stanley’s chief investment officer Mike Wilson shows that earnings revisions breadth — or the ratio of companies raising forecasts to those cutting forecasts — has rebounded as dramatically as, and in lockstep with, the S&P 500 itself.
“Many market participants do not appreciate how strong this very fundamental driver has been over the past several months,” Wilson told Yahoo Finance.

DB2
The public is now being judicious in its purchasing decisions, buying ahead of the tariffs.
Being judicious might be the only econ throwback to the pre-COVID era.