Ben’s Portfolio update end of September 2023
Returns and portfolio holdings:
Portfolio
Notes


2020
63.6%
Since May 12, 2020, where I started this portfolio with over 40 companies, mostly holding large cap tech & FAANG, but also some high-growth SaaS.


2021
13.1%
Discovered Saul’s board in February 2021 and started concentrating to 16 companies through December 2021.


2022
-60.7%
Concentrated a bit more through July 2022 from which point I started posting my monthly updates on Saul’s board, holding about 12 or fewer positions.


2023
YTD
Month


Jan
8.3%
8.3%


Feb
16.3%
7.3%


Mar
17.9%
1.4%


Apr
5.2%
-10.8%


May
40.5%
33.5%


Jun
38.6%
-1.3%


Jul
50.7%
8.7%


Aug
41.2%
-6.3%


Sep
35.3%
-4.2%
These are my current positions:
Sep 2023
Aug 2023
First buy*


Snowflake
17.0%
16.7%
2/8/2021


Datadog
16.8%
17.1%
5/13/2020


Cloudflare
14.8%
14.7%
11/2/2020


Nvidia
14.2%
15.5%
5/13/2020


Crowdstrike
14.1%
13.1%
5/13/2020


Zscaler
12.9%
12.4%
3/4/2021


Monday
6.6%
7.1%
9/13/2021


TradeDesk
2.4%
2.4%
5/13/2020


Enphase
1.1%
1.1%
5/15/2020
*held through today
Company comments:
Crowdstrike:
Crowdstrike reported Fiscal Q2 2024 earnings on August 30, 2023. Revenue was $732M (5.6% QoQ, 36.7% YoY), versus my expected $741M (7% QoQ, 39% YoY). This was quite a bit lower than I had hoped for, even given their seasonally slowest quarter for revenue growth. On the bright side, their Q3 guide came in right where I expected it at $777M, setting them up for QoQ revenue growth re-acceleration and given their updated FY guide (~0.7% mid-point increase), not only from Q2 to Q3 but also from Q3 to Q4: Their midpoint Q3 guide is 6.2% QoQ growth and their implied Q4 guide is 7.6% QoQ growth, significantly above this Q’s 5.6%. And of course they are likely to beat their Q3 guide as they always have done so in the past.
ARR growth already re-accelerated sequentially in Q2 to 7.2%, up from 6.8% in Q1 and while net new ARR was a little light in Q1, Q2 was strong, adding $196M to ARR, a 12.6% QoQ increase. This looks good to me, especially with their seasonality: “Given the annual budget approval process of many of our customers, we see seasonal patterns in our business. Net new ARR generation is typically greater in the second half of the year, particularly in the fourth quarter, as compared to the first half of the year.”
RPO grew anywhere from 7.1% to 10.1% QoQ (Q2 RPO was in-between $3.550b and $3.649b, quoted as $3.6b), which is a sharp re-acceleration from Q1’s sequential 1.6% drop and significantly higher than last Q2’s 6.4% sequential increase. For perspective: as I wrote in my June recap (Ben’s Portfolio update end of June 2023), Q1’s drop in RPO was due to Crowdstrike reducing their gigantic backlog, while deferred revenue continued to grow resulting in overall lower RPO. This Q2, backlog grew again back to about $1.0b (from their 10Q), explaining part of their RPO increase. This goes on top of a 4.3% QoQ increase of deferred revenue. Bottom-line: it is great to see the sharp re-acceleration in RPO, which was driven by both increased backlog and deferred revenue.
While Crowdstrike no longer quotes total customer numbers (I guess partly because this metric is hard to track if a significant fraction of customers goes through managed service providers), they continued to make steady progress on multi-product adoption, where module adoption rates increased by 1% in each cohort, to 63%, 41% and 24% for five or more, six or more and seven or more modules, respectively.
Everything seems in order on the margin front: They were able to keep their subscription gross margin at 80% and total gross margin at 78%. Before getting into the profitability margins, it is worth pointing out that their operating expenses have dropped every year by about 5% (taking Q2 as reference) for the last four years and they have now reached their previous long-term operating model, which they just updated:


They think they will reach these new targets within the next 3 to 5 years. This is a great development and puts some concerns to rest that Crowdstrike has basically reached is peak. Also, I recommend you look through the whole investor briefing to see that they are also still far from penetrating their quickly increasing TAM and that there are a lot of new technology and new revenue opportunities on the horizon: https://ir.crowdstrike.com/static-files/f8388f09-30ab-4245-b87f-07e7db658972.
With that out of the way, I wanted to see a Q2 operating income margin of about 17%, a net margin of about 20% and a FCF margin of about 26%. Operating income margin was 21%, net margin was 24.5% and FCF margin was 26%, so really well done here! Especially considering this statement: “In addition, we also experience seasonality in our operating margin, typically with a lower margin in the first half of our fiscal year due to a step up in costs for payroll taxes and annual sales and marketing events. This also impacts the timing of operating cash flow.” So the already fantastic margins might improve even more in H2. Their operating income and net income guides for Q3 would also suggest this: applying the average beat over the last 6 quarters (15% on operating income and 20% on net income), operating income could go to $180M, doubling from a year ago and their net income could go to $218M, more than doubling from last Q3.
Zscaler:
Zscaler reported Fiscal Q4 2023 on 9/5/23. Revenue was $455M (8.6% QoQ, 43% YoY), basically as I expected from my (modified) billings model. They gave a new Q1 guide for $473M (4% QoQ, 33% YoY), slightly below my expected $477M (5% QoQ, 34% YoY). A real highlight however was billings, which came in at $719M (versus my expected $711M), growing 49.1% sequentially. With that we can update our billings model and now get a prediction for Q1 revenue, taking the average of the last four quarters of billings (variable “x” in millions) and plugging it into the updated equation: Rev = 0.977 * x + $2.65M = $500M. This is visually shown in below figure, showing you how nicely this fit works to predict next Q’s revenue:

I made some modifications to this model by evaluating how the residuals evolve over time which brings me to an estimated Q1 revenue of about $504M (in the past, including for this Q4, this modified model yielded slightly better predictions). In any case, this would bring us to a sequential revenue growth rate of around 10%, which would be a strong sequential re-acceleration, in comparison to this Q’s 8.6%, which was already an acceleration over Q3’s 8.1%. So this is a very healthy revenue trend! But what about their new, initial FY24 guide?
Their initial FY24 revenue guide was for $2.058b at the midpoint, corresponding to 27.3% YoY growth. I think this is a shameless lowball. Why? Let’s do some modeling applying our knowledge about how billings leads to revenue: Just next to their revenue FY guide they state to expect $2.540b in calculated billings in FY24. Applying a rough historical seasonality pattern how could billings develop in the next four quarters to end up with the guided billings amount? Here is an example for possible QoQ billings growth rates in FY24:
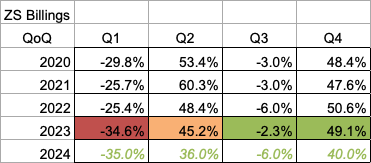
Here I am showing you also the QoQ billings growth rates of previous years, so you can see the seasonality pattern. Now, if they were to grow QoQ billings as in above table, they would end up exactly with their billings guide for FY24 (which they are surely aiming to beat!). Now we can plug the resulting quarterly billings numbers into our billings-revenue model from above and calculate the expected revenue as a result from that. With above example for billings from 4Q23 to 3Q24, I get in-between $2.19b - $2.21b in revenue for FY24. That’s a YoY growth rate of 35.5% - 36.7%. So, if they would have provided an FY revenue guide that was consistent with their billings FY guide, it would have been for 36% YoY growth, not 27.3%. And again, they surely aim to beat their billings guide. In fact, look how much the FY24 QoQ billings growth percentages have to drop in comparison to the corresponding quarters in the previous year(s), just to meet their FY billings guide!
Just for fun, I calculated the case where they would exactly replicate the FY23 QoQ billings percentages. With that they would end up with FY24 billings of $2.82b and FY24 revenue $2.23b - $2.25b which would correspond to YoY growth of 38% - 39%. One could even argue that FY24 could be better than FY23 was, just assuming that macro conditions will become better in the next 12 month than they were in the last 12 months, leaving them with even more revenue growth. I think the Q1 report will be especially interesting here: 1Q23 had a much lower QoQ billings growth than 1Q22 and if 1Q24 will be closer to 1Q21 or 1Q22, this would set them up to achieve FY24 revenue growth of 45% to 46%, assuming Q2 and Q3 billings QoQ growth rates come in around 45% and -6%, respectively.
So bottom-line: while they have likely thrown us a lowball in FY revenue guide of only 27.3% YoY growth, they should have really guided for 36% YoY, just to be consistent with their billings guide, but are likely to beat that as well and might end up with YoY revenue growth north of 40% for FY24, which would be fantastic considering their scale, combined with their progress on profitability.
This outlook is supported by strong secondary metrics they delivered in Q4: RPO grew sequentially by 16%, to $3.5b, 49% of which is current. Deferred Revenue increased sequentially by 22.5%, to $1.4b. These are strong numbers, but the highlight was customer growth: >$100k ARR customers grew 7.3% QoQ, up from 4.1% last Q and 5.4% the Q before. They added 177 new large customers, almost twice as many as in Q3. Even better, they added 49 >$1M ARR customers, more than twice as many as in Q3, growing very large customers by 12.3% QoQ - wow.
And finally, on the profitability front, we see their margin break-out that started in Q3 continue in Q4: Operating income margin, which was pretty much constant around 10-12% since they became profitable in 2019, jumped to 15% in Q3 and now to 18.9% in Q4 ($86M). Similarly, net income margin progressed in FY23 from Q1 to Q4 as follows: 12.4% → 14.9% → 17.8% → 22.2%. Finally, they exceeded my expectation for FCF and delivered a margin of 22.3% - Excellent!
Wrapping it up
This wraps up another earnings season and I am feeling pretty optimistic given the recent business trends and outlooks of my companies. So here is to them delivering on those outlooks!
Thanks for reading and I wish you all a great October!
Ben
Past recaps
July 2022: Ben’s Portfolio end of July 2022 - Saul’s Investing Discussions - Motley Fool Community
August 2022: Ben’s Portfolio end of August 2022 - Saul’s Investing Discussions - Motley Fool Community
September 2022: Ben’s Portfolio update end of September 2022
October 2022: Ben’s Portfolio update end of October 2022
November 2022: Ben’s Portfolio update end of November 2022
December 2022: Ben’s Portfolio update end of December 2022
January 2023: Ben’s Portfolio update end of January 2023
February 2023: Ben’s Portfolio update end of February 2023
March 2023: Ben’s Portfolio update end of March 2023
April 2023: Ben’s Portfolio update end of April 2023
May 2023: Ben’s Portfolio update end of May 2023
June 2023: Ben’s Portfolio update end of June 2023
July 2023: Ben’s Portfolio update end of July 2023
August 2023: Ben’s Portfolio update end of August 2023