Pete,
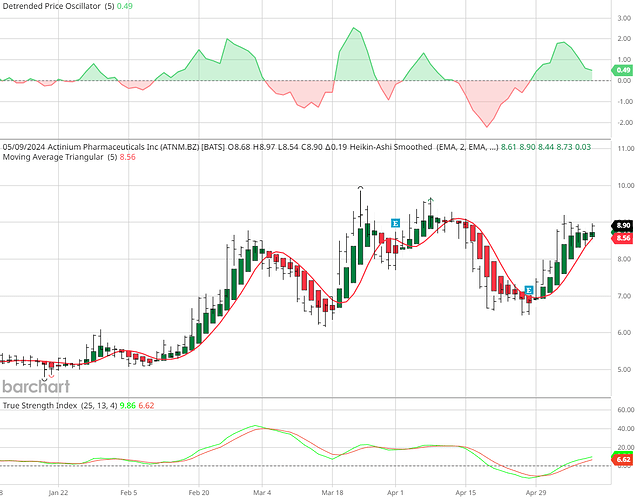
I am using 3 panels
check off the Extended Hours and check off Real time boxes.
to be created from SCRATCH D !
Top panel consists of DPO (5) Detrended Price Oscillator
Apply to: fill in the box New Pane
where it says period show 5
Next section down
(area) toogle fliop to the right. Width - =0 change the colour click on the colour bar just above the fourth row from the right to the left. It should look pinkish from the palet.
The second box to the right =0 as well and samething with a coolour like greenish pistachio as a guess.
the next section down
Zero 0 in the box-------- Width - Dash - black box as a default.
click Appply
The second panel.
click on study box at the top and look for the following
DPO (5) - Detrended Price Oscillator
HASMO (EMA, 2, EMA, 2) - Heikin-Ashi Smoothed
MATRI (5) - Moving Average Triangular
TSI (25, 13, 4) -True Strength Index
DPO (5) is expained above
next
Heikin-Ashi Smoothed
Apply to: fill in the box Main chart Window
Smoothing1 EMA in the box Perd1 1 in the box
Smoothing2 EMA in the box Period 2 in the box
(candlestick) toogle to the right
leave the colours alone.
Moving Average Triangular
Apply to: fill in the box Main chart Windwo
Input
Period 5 in the box
MA-tRIANGULAR (line) toggle the buttom to the right
Width - red box colour
click on Apply
True Strength Index
Apply to: fill in New Pane
input
Period1 fill in 25 in the box Period 2 fill in 13 in the box
Period3 fill in 4 in the box
True Strenght index
(line) toogle the button to the right Width - Green in the box
True Strength inex
Signal (line) toogle the button to the right Width - Red Box
Zero fill in 0 in the box width - dash - black box (default)
Click on APPLY box (blue)
Next check the Settings box at the top and click on it.
Symbol -
Bar Type
OHLC Bars - toggle to the right
black box select L
High/low Price Markers
check show
check off Extended Hours
check off Readltime Cboe BZH
click apply blue box
DISPLAY
Chart Size
Large
symbol & study Data
check off Headers
check off shwo Trackball
check off shwo Crosshair
Cross Bar
Horizontal black box short Dot
Vertical black box short Dot
Clicck APPLY
SCALE
Scale Type
check off Linear
Scale Values
check off Price
Show Price Labels
check off Exact Value
Right Margin Free Space
insert 2 bars
Click APPLY blue box
Click on EVENTS
Events
check off Dividedns earnsis
Click on the APPLY blue box
And finally
click on Appearance
Tools Panel
check off show
Grids
check off Basic Grid
Grid Color
Clor is default gray
Font Size (px)
Horizontal should be 12 in the box
Vertical shoudl be 12 in the box
click on APPLY
The pinkish line is either my buy price or my sell price as a target from the Tools box at the top.
The name of my Chart is “Simon Sez - Seeker” for my Trend Seeker that I described earlier of the stock I like to track. in relationship to the “Chart of the Day”.
Premier Membership at $199.95 + tax. per year. Barchart and Stockcharts are tax deductaable writeoffs.
I wish you thye best
Quill -
You will that the TSI xovers will match the red and green turn overs as a referecne.


