One thing I see for $CG is that the last high is a lower high, perhaps that was a yellow flag.
2 Likes
Help me out here, I’m missing something. Which is not unusual. Last “wick high” was like 12/11 at 54.92, are you referring to the 11/25 high (of wick, not close) at 55.11. Note, it was also a very long wick in a reversing spinning top. Not sure I personally make much of that. But always happy to hear perspectives. Love to learn.
Lakedog
Dang, winds picking up. Better go check the generator.
The problem I see with that is you never could trade on an inside day or a pennant flag.
1 Like

Wish I could tell you a definitive story. Actually, was formulating one idea then the Fed must of struck. Significant drop. Muddy’s the water even more.
It’s an interesting stock. Here’s the previous markup from HTF discussion (same channel lines, fibs), with up dated data and candles.

So, it did go down and fill the gap and appeared like it was going to rally last week. But, never made it out of the channel (yet). It’s trying to build some recurrent momentum, just not very dynamic. Had better volume in the last couple days, yet didn’t really go anywhere. With indecisive candles. Can’t tell if it’s the core stock or Feds-OPEX.
If you ever look at RRG’s in StockCharts, this is an interesting one to put on a daily with the financial or even sectors and run animate. It literally orbits all others.
I’m of no help to you, sorry. Personally, I am a bit mesmerized by it, so out of curiosity and the added attention of having skin in the game, I have kept my position to watch. Still positive. I’m okay with a small profit and some “dead” money but not recommending such. It’s a small position and my trading needs are minimal. I can afford some educational activity. Think it’s the RRG that has me interested. You might want to evaluate your portfolio as a whole in deciding how to approach.
Lakedog
Thanks Lake. I was curious why you don’t see this as a big red flag? Lower lows and lower highs. Yet everyone seems to think that is ok. But with a VCP pattern, which most likely will have lower highs and lows because of the contraction, that is a red flag? Is it because you recognize this pattern but not a VCP pattern?
Is it hesitating and concerning, you bet; however, the price action is still in a flag or perhaps more appropriately, a channel. Here’s the end of day trading chart:
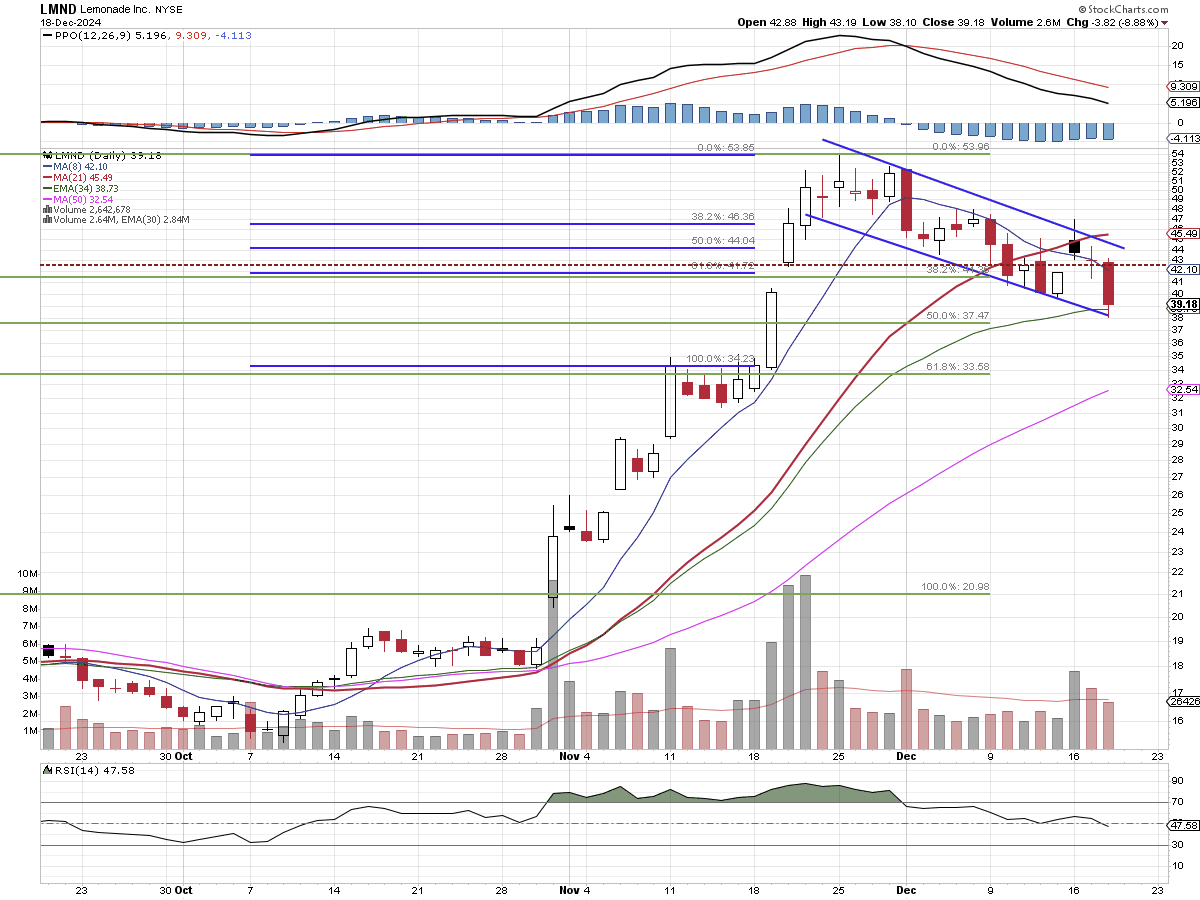
Still appears in a channel. Of interest, and a learning point for me, this is the saved chart with annotations from two weeks ago. I just looked and discovered that the specific channel has moved a little. I thought it never would do that. I need to watch that in the future.
Pull-backs, and so far this is only to the 34 EMA, are part of the process of stocks. Part of the difficulty also is that stocks don’t trade in a vacuum. Just as a rising tide may lift all boats, a receding tide may strand or sink boats. That’s a big part of what we are dealing with right now.
Patterns do not define the movement. They suggest possible outcomes and add some probability to the mix. For any, there is always the uncertainty of direction. As time moves on, the up move becomes less likely. But that is why you wait for the confirmation of the move.
Apologies, I have not had time to review the VCP. My brief glance gave me the impression that it is like a pennant, with lower highs and highers low. I acknowledge this specific LMND movement more as a flag/channel. Most channels arising from an uptrend, will return to an uptrend. But most is not all. Calling a move a pennant or VCP or a banana is less critical than just trying to glean the potential action that may occur due to the price action. Of note, it is in a daily squeeze, which is consolidation. Currently, it does seem to be running out of gas in momentum and may break down. I’m not holding at this split second because I recognize a specific pattern or action that tells me it’s going to blow up to a winner. Probably more the contrary. It is just not a major outlay for me, and I’m willing to watch with skin in the game to learn.
This is why I made the reference to look at your portfolio. We all have positions that we cut in a hurry and others we may hang on to longer than we should. I know, Bill was a cut at 7% dude. If that is you, you should cut by 7%. Period. I’m not negative, but almost flat. I’m willing to ride for a bit because it doesn’t hurt me significantly. That has nothing to do with any real rules. If I cut it now, I’ll forget it by tomorrow. I want to learn and try to grow from this position. I have plenty of other positive and now closed positions. There is no technical analysis reason that tells me to hold, other than it still is in a channel. But most channels are used as very short term plays or as entry positions, not holding. This is out of the play book. I’m exhausted, probably have made no sense. Go with your rules and thoughts.
Lakedog
5 Likes
I bought some VIK on 2/16 when it was acting strong and then again Friday on an upside reversal. This was its first trip to the 50dma since the breakout. Other cruise lines like RCL and CCL are doing well, making me feel like a consumer comeback will keep helping this stock.
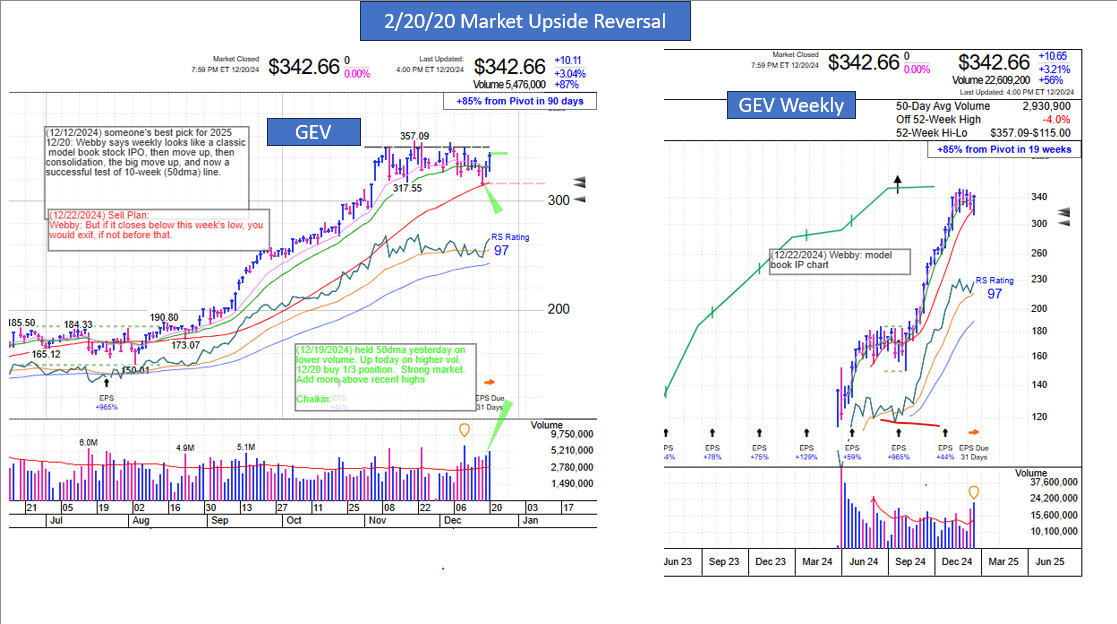
On the Friday video with Webby, they were pointing out a “model book” chart of an IPO stock, GEV, and showing a classic initial run up, then a consolidation, then a large move. If you look at GEV and VIK you will see similarities that make me want to not be too quick to sell VIK since I have good gains.

I had been watching GEV and decided this upside revesal was a good time to start
As noted before, I sold half IBKR on the market drop because I needed to raise a little cash just in case. Friday it reversed up off the 50dma so I bought back the equivalent of 1/6 a position, leaving 1/3 to go to become whole again. In this case, it was very close to my sell price and I am willing to buy more on strength. I feel good about this because in the past I would have a psychological block about buying a stock back just after I sold. We are told Bill had zero problem doing this when the signals indicated to buy, so I am trying to do that.

My previous screenshots had the wrong date label, but I am not going to fix that. This next one is correct.
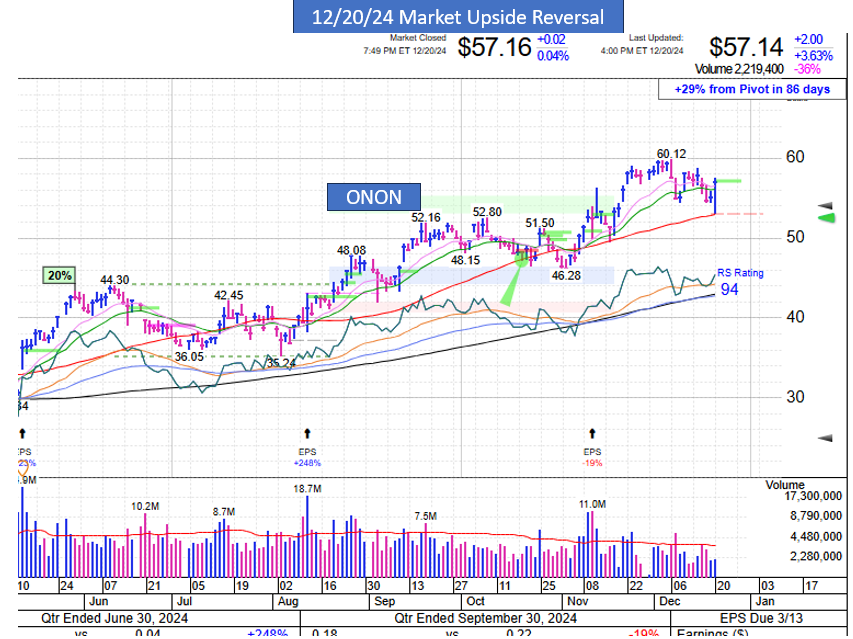
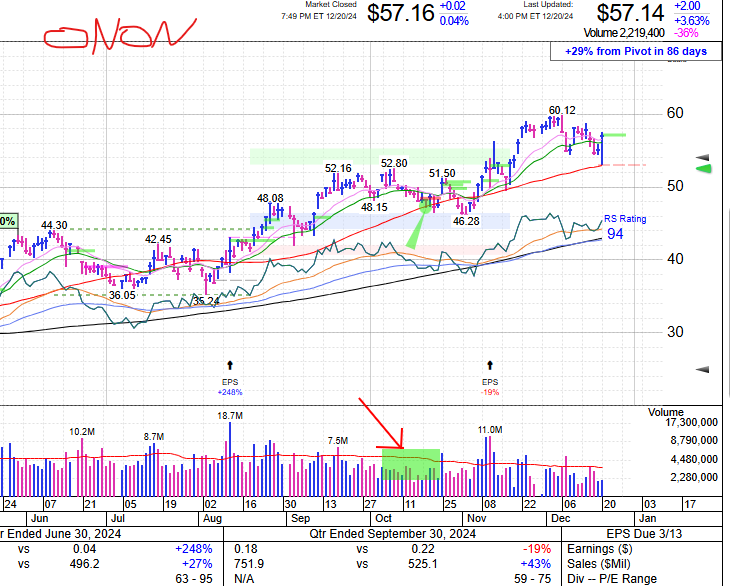
Bill would always say you have to buy something on an FTD and Webby says the same about days like this, so I bought more. I took my ONON position from 100% to 133% sizing. These and Hokas are hot shoes I see everywhere, they have taken shelf space from Nike at footlocker. There is great potential here for a multibagger run. Never underestimate direct to consumer fashion and restaurant fads like Decker, ONON, CAVA, SG, SHAK. Cracker Barrel was a huge winner for Peter Lynch. CMG is a huge winner. TCBY in the 1980s. Sketchers had a shoe run, I remember Chicos had a big run, ANF, etc. When consumers start buying it and they spread across the country, great things can happen.
On the warning side, this is the third or fourth trip to the 50dma since the breakout, that is not a good sign, but it has held pretty well.
1 Like
Some analysis as I am looking through holdings.
$GVA had a huge upside reversal on 10/31/24 due to earnings report. I did not add, what a terrible mistake. Upside reversals are great. Earning boosts are usually very good news.
Currently below 50dma, so why not sell. On Friday it did go above it for a bit, but closed below. It was a positive day on very strong volume, so I will continue to hold with my large gain.
GVA Chart

$VIK why didn’t I buy on the big upside reversal day. Was I psyched out by the big move and the down finish? The finish was near the high of the trading range, a sign of strength. It finished above moving averages. I did add a couple days later as it push higher on high volume, but it faded a little at the close.

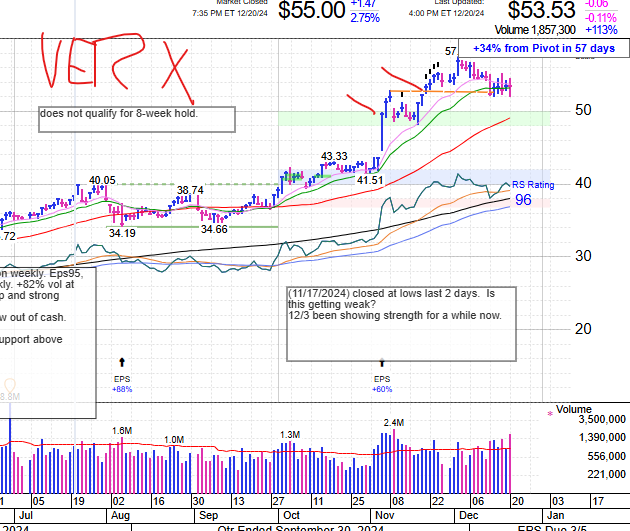
VERX had a big gap up on earnings day, strong volume. I don’t feel too bad about waiting. Perhaps I was just happy with my holdings, but that is a bad answer. I did draw that dashed line as an alert, but I still did not add when it moved above that. It held up well in the downturn on 12/18 and RS is 96. I should look for a place to buy above this little consolidation. Will set alert.
$ONON back in October, it gently moved down to the 50dma and very low volume, a perfect way to decline. I annotated it at the time with the green circle an pointer so I would keep seeing it as I looked at the chart. It gapped up of the 50 with good volume and I bought it. It went below 50 again, but on low volume and I held it. Can’t recall holding it because the volume was low, so maybe lucky I did not sell. The next trip to the 50 was also on low volume and I did not buy as it rebounded on slightly above avg volume. I did finally buy on the 12/20 upside reversal, but that was very low volume so I need to watch out. Have an alert set, but should set a hard stop for a percent or two below the 50. Since vol was low, my expectation is that it will need to consolidate a little bit.
$ALAB up on strong vol Friday, why didn’t I add.

$SE had extremely low selling volume on bad market day of 12/18. It closed a little lower on upside reversal day of 12/20, but it had its own upside reversal on higher volume and closed near top of range. Put this on your watch list for a breakout above the recent consolidation around $119.47 high.

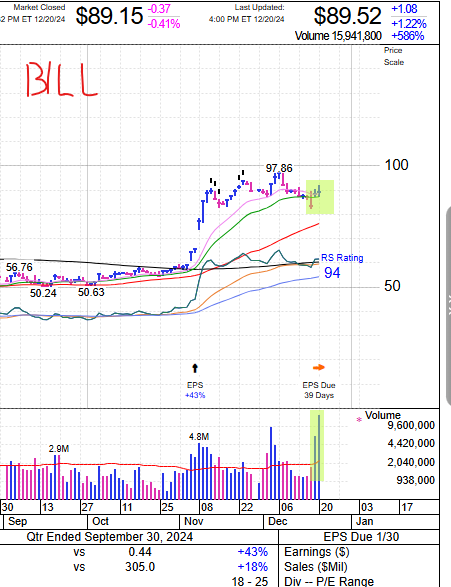
$BILL looks strong. Look at the VERY low volume on 12/18 “crash” day, and then look at the very high up volume next two days. Not many stocks did that. Feels like a must buy for swing or spec traders.
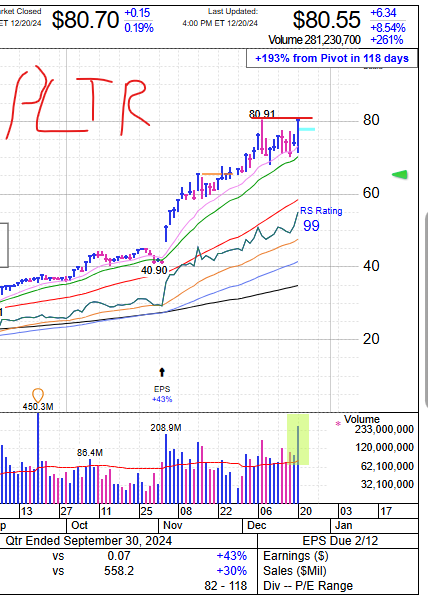
$PLTR Huge Vol on 12/20 and about to set new highs. Very strong. Never fell below 21dma. You have to have a much weaker stock than that you want to swap out ;-)_
$PAYO

look at PSTG, URBN, CRDO, BROS,
Super Specs: SOUN, IONQ
3 Likes
Quick followup and closure on LMND.
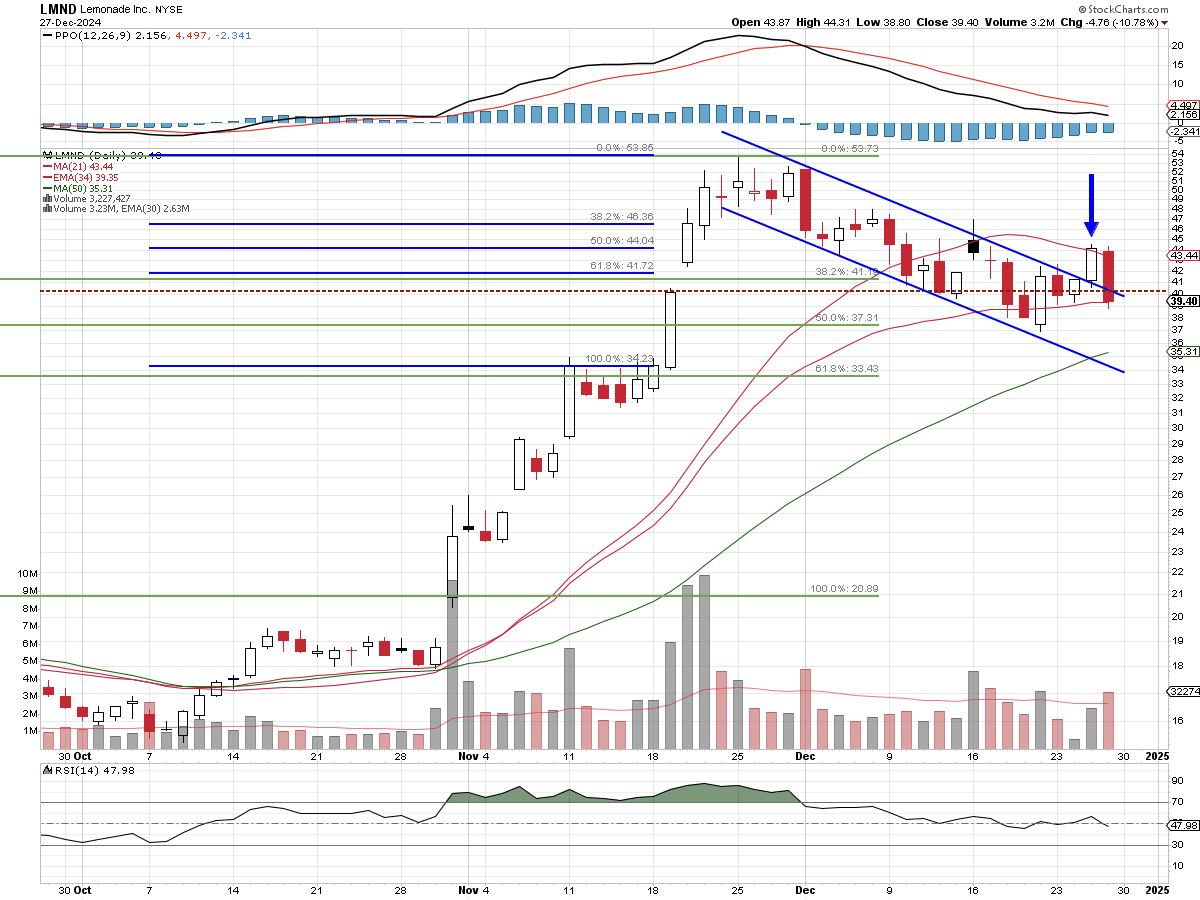
It broke the channel upwards, as expected, on the 26th. Pretty classic channel breakout. That’s what I was watching for. But as said before, stocks don’t trade in a vacuum. The market emesis drug it back down to the 34 ema. From classic TA, this play is over until a new pattern is formed. It could break upwards again, but such moves tend to be weak and less definitive. Note, it actually has not reached the 50 sma which could be it’s next target. Also, this market decline was abrupt but still within the realm of a normal adjustment. The VIX shot up but markedly declined to 15.95. Prefer under 15 but this ain’t panic levels.
I have been watching LMND and trying to evaluate using the RRG. While it clearly can be a supportive chart, can’t say it’s striking me like an early warning system. Anybody use it much??
Hope everyone had happy holidays and here’s to a Happy New Year!! Be safe.
Lakedog
3 Likes
Put in a buy-stop for RL. I first read about this in my “Chaikin” service (the money flow inventor). It was their monthly rec on 12/19/24. It has some flaws, but is improving. Was beat up in COVID, but is now easily paying off debt with cash flow. Strong ROE.
Their short rec
Buy Ralph Lauren (NYSE: RL) today . Plan to hold for the next 12 to 24 months as digitization brings the company’s luxury business to new heights . We’ll protect our downside with a 30% trailing stop
My initial thought was “Ugh, a clothing company”, so I did not buy. But today, IBD said this
One name to watch outside the Dow Jones index is retailer Ralph Lauren.
Ralph Lauren is within striking distance of a 237.16 buy point in a [base-on-base formation] Shares climbed 0.6% Monday afternoon. In a bullish sign, the relative strength line hit a new high, triggering the blue dot on the IBD MarketSurge chart.
Ralph Lauren stock backstory: Based in New York, Ralph Lauren offers luxury lifestyle products. It operates across five categories: apparel, footwear & accessories, home, fragrances and hospitality. Its brands include Polo Ralph Lauren, Chaps and more.
Earlier this year, Ralph Lauren expanded its AI-driven intelligent inventory technology. In the U.S., that move builds on a pilot program initiated in its European and Asian stores.
The use of AI helps the company drive sales by improving in-stock availability on sizing and bestselling products. Over time, Ralph Lauren plans to roll out this predictive buying model across a wide range of categories and markets.
The daily chart shows this holding up well during the dips of the last few days. ON 12/19, it was just below the 21dma, but jumped above it with strength on 12/20 and has never really looked back. Today, it dipped below it, but had an upside reversal to retake the 21dma.
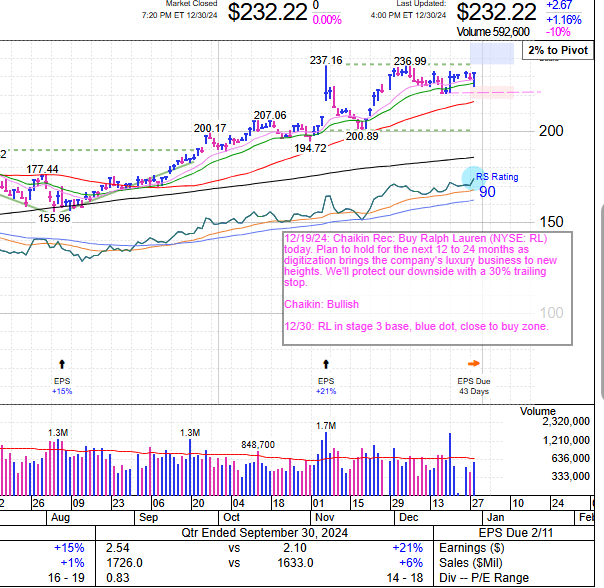
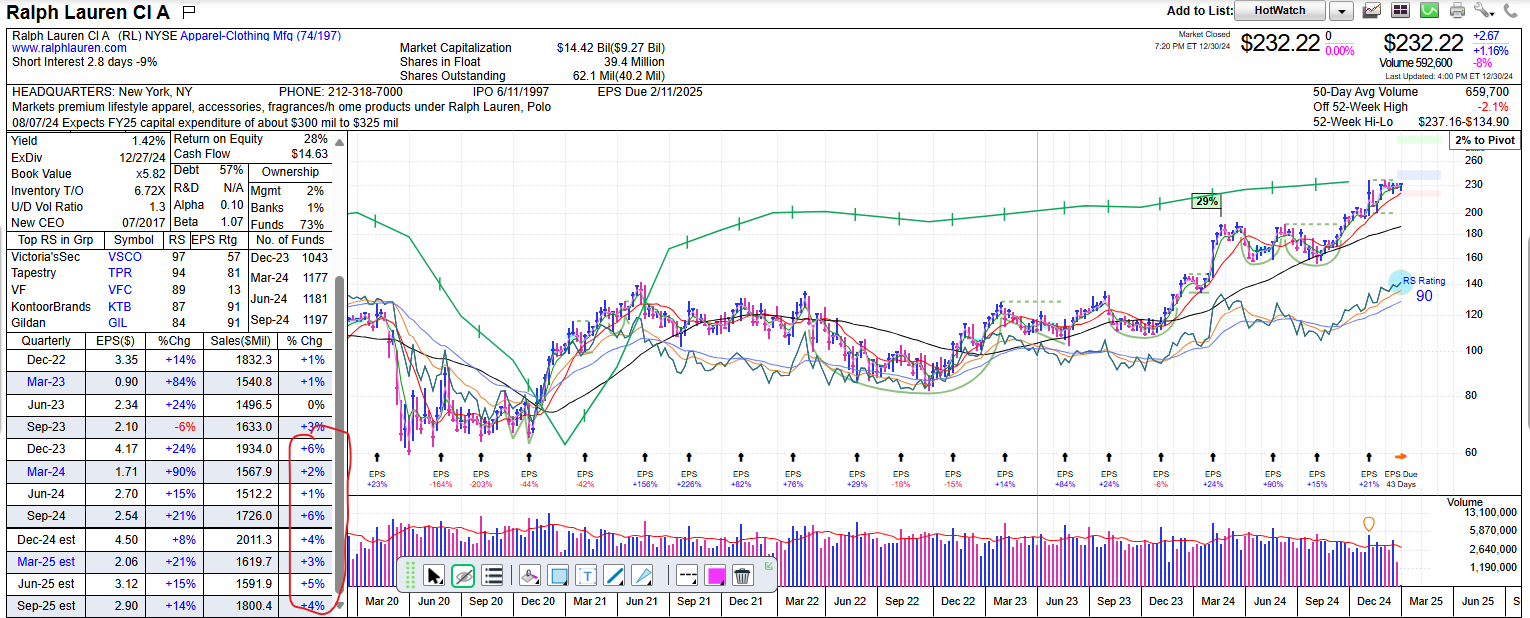
The weekly shows its fairly stead recover since the beginning of 2023. It had a huge week on 2/9/24, blasting out of a stage 1 flat base on earnings. You can see in the table that Sales growth is very anemic, but the bet is that digitization and AI will change that.
I like it when two different systems seem to confirm a buy. I have put a buy-stop in for $237.06 for half a position in my IBD account. Today could have been a good day to get in early. Oh well.
2 Likes
Lakedog, nice analysis. Webby would say the same thing with different words…"When the stock broke out of the channel, our expectations were that it would continue up, but when it fell back below the upper channel line the next day, that was an expectation braker and we sold our swing trade position.
You are totally supporting my long-standing issue with IBD. They have often infused their own terminology for general technical analysis statements as if they are the first to describe them. Changing the meaning of even simple things like dma or in this case, “Expectation breaker” = breakout failure (for us old-fart technical analysis folks).
Please don’t misinterpret my perspective, I totally, absolutely respect the folks at IBD, but personally, can’t get over my impression meeting Bill O’Neil. He was after an angle to pedal his perspective by making a “club.” Smart marketing. But Webster and Justin are solid data analyst and I agree with their approach to understand with detailed facts. And a “failed breakout” is a “failed breakout” by any other name and doesn’t smell so sweet. ![]()
Words were made by people to transmit meaning. If the words are spoken in English, Spanish, or German does that make them any less true? I never focus on the language, but on what the words mean. I find, that some people want to use words in order to elevate themselves rather than bring understanding to what they are talking about. So it really doesn’t matter what IBD calls anything as long as you understand the meaning of what they are trying to convey.
Sure, but I like to use “Expectation Breaker” to cover a myriad of bad things, and that makes is a useful concept. Sure, going below the 21dma or 50dma, failing a breakout, getting an upside reversal without a follow through are different types of failures, but all in the same group. It makes it simpler for me to talk about I think.
A bad driver might go too fast, tailgate too close, run yellow lights, text while driving. I just want their bumper sticker to say “Bad driver, stay away” ![]()
Just giving my perspective, which I’m allowed. Sorry if it doesn’t match yours. That’s what a conversation is all about.
Happy holidays and happy hunting in the future.
1 Like
I thought we all were just giving our perspective. Sorry about that. Have a great year Lake.
This is a riskier time to invest, but have to keep building watchlists and finding strong stocks.
$BROS showed a great bounce of 21dma with really good volume considering a lot of traders are still on vacation.

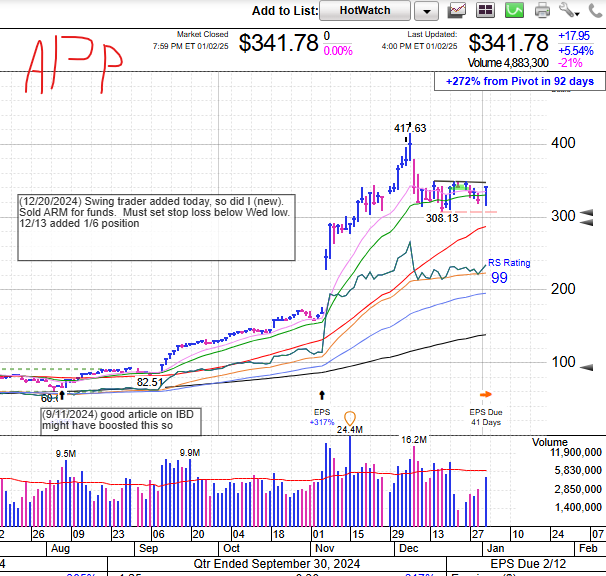
$APP never fell below my stop limit. RS rating is 99! Moving toward a break above a little consolidation area. Would want to buy if market was also showing real strength.
$CRDO held up well after that huge gap up, still building the flag. Nice bounce off 21dma today. I won’t add in this market, but happy to see the strength. Another RS of 99.
$NET was up on above avg volume, RS91. It barely went below its 21dma during the decline. Good to watch.

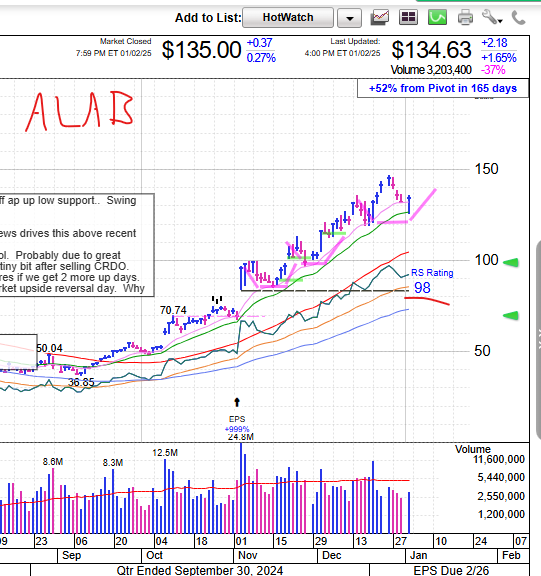
$ALAB bouncing of 21dma with RS of 98
I think some NatGas and LNG plays will be good under new admin, GLNG is one I bought as a position trade in my IBD account. It held the 21dma nicely in recent market declines. Had nice breakout then some “ants”, after that it moved along the 21dma. News today was that Ukraine shutoff the NatGas pipeline from Russia to at least some countries. If you want a cheap value trade, look at $NFE coming off its bottom since the election. That is definitely not an IBD trade yet. $EQT is ready to breakout.

Other: check $MMYT, $GEV, $SPOT, $RDDT, $HOOD,
My results for the year: IBD trading account was up 23.9%. Barely beating the SPY and underperforming the QQQ and Naz.
A lot of work to be in a tie with a passive ETF, but I am competitive and enjoy it, so will keep striving for improvement. This board has been a good place to discuss and looking forward to more of it in 2025. Thanks to all of you who participate.
For 2024, the S&P 500 jumped 23.3% after 2023’s 24.2% advance, capping a two-year gain of 53.2%, the best since 1997-98. The Nasdaq leaped 28.6% in 2024. The Dow Jones advanced 12.9% in the past year.
2 Likes
The market gave me hope today when it seemed to be confirming Monday’s move up, so I did some buying.
$RL is a new position for me. It was recommended in my (cheap) Chaikin service and it had been talked about on IBD. The blue line is where I first bought it in my “Chaikin” account, and the green lines are where I bought it in my IBD account today. Seems silly, but that is how I do. It looked ripe for a breakout so instead of buying it “early” after hours I put in a buy-stop just above the pivot. (I should have bought a little after hours). When I got back at lunch time, the limit had hit for a 1/3 position and the stock was about 2% into the buy zone, so I bought another 1/3 manually. IBD generally says by 1/2 at first, then 30%, then the final 20% so you don’t get top heavy. I gotta start trying that this year.

I had a 1/3 position in GEV bought on 12/20. Last night in the video they pointed out that it looked like a high-tight-flag with a nice consolidation. So I put in two stacked buy-stops just above the pivot and maybe 2% into the buy zone. The afterhours price was reasonable, buy when I work up it was way up, and it gapped up on the open, jumping over my stops.
With a chart like that, I had to have some, so bought my second 1/3 position manually about 4% into the buy zone.

I have held $IBKR for a bit now and am up 25%. I trimmed half when the market looked iffy, but when things turn up, I started buying it back. You can see that it had a beautiful upside reversal off the 50dma last Thursday, a day when the market was pretty bad. I saw that, but I could not bring myself to buy on a bad day. Friday was a good day and I still did not buy. That was truly an unforced error. So I bought back another 1/6 today and will be willing to go larger than a full position if it has a good breakout. Live and maybe learn.

I recently bought a new IBD position in $META, and like IBKR, it had an upside reversal off the 50dma on Thursday and also broke a downward trend line. In this case I was willing to buy the next day and then again today when it strongly moved back into the buy zone.

Finally, I picked up some NVDA today. I had been holding a Dec 2023 position for a long time and finally sold recently. There were better early-buy opportunities, but I preferred other stocks at the time. Now I have a little FOMO and wanted to start a position before Jensen spoke tonight. NVDA has basically been going sideways since June, so it is due. We shall see.

2 Likes