Doc,
I do nothing. You are probably mixing techniques 'tween HA ( candle stix consumes too much of my tyme) and what Simon Sez is to do per the two (2) simple rules.
All my charts are via Simon Sez.
Have you ever been to a Through Breed Horse Races?
Going to try using the Horse Racing analogy in the simplest form.
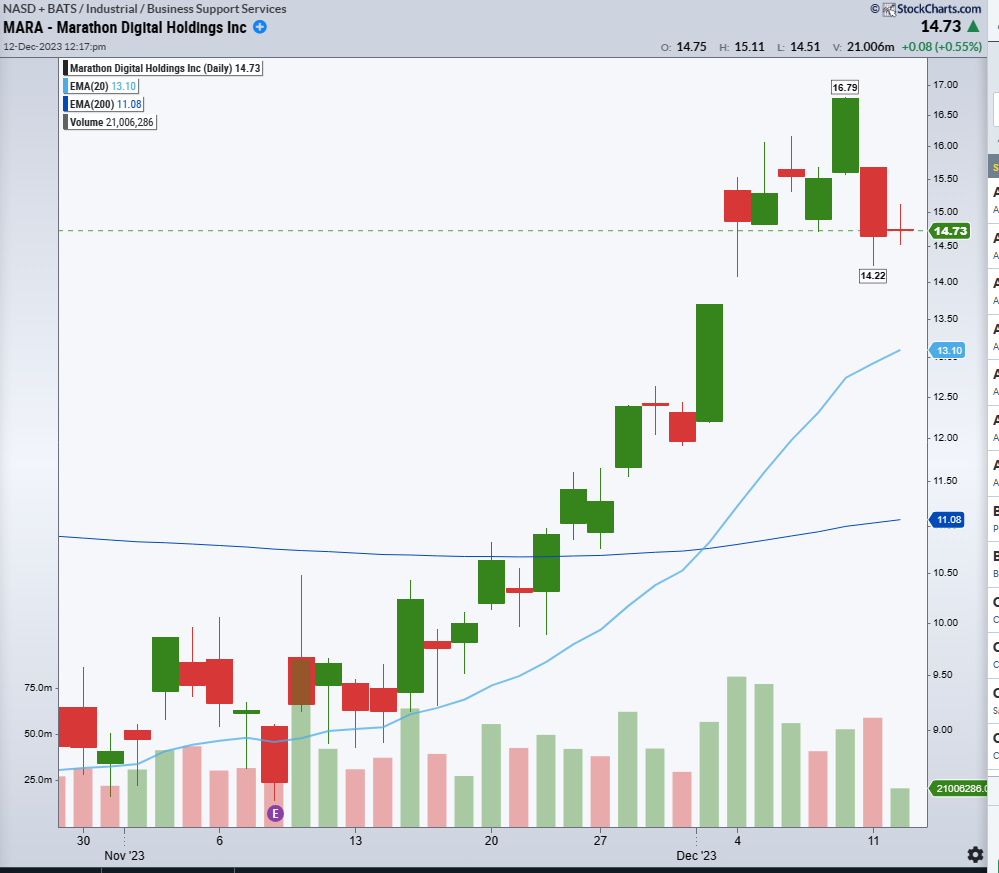
Let’s look at October 27, 2023 you will see a price label (aka ) the starting Gate where the horse is ready to jump out at the sound of the screaming bell sounds.
ring ring ring the very next bar is called Out of the Gate and the horse takes off.
At around 11/29/2023 the horse is now around the far turn and heading for the Finish Line and should win the race.
Now the Finish line just posted a label on 12/4/2023 and the race is over the following bar after the horse passed the Finished line.
The horse goes to the winning circle and collects his trophy and a bundle of cash.
Notice not one werd was mentioned about GREEN or RED bars.
In review :
Please read the following over and over until it syncs in at https://discussion.fool.com/t/simon-sez-iii-in-review/90365
Understand :
Out of the Gate (the following bar after the Price Label you BUY).
Finish Line (the following bar after the Price Label you SELL)
ignore all GREEN and or RED bars unless you want to buy more shares with the GREEN Bars to increae your profits at the Finish Line.
The only way to see the Price Labels is via StockCharts.
The setup for Stockcharts is as follows:
Class - Stock Charts set up procedure- per Simon’s Werld®
Quill’s Stockcharts setup:
- on the URL bar type in stockcharts.com then Enter
- click on "Charts & Tools.
- find StockChartsACP and enter a Symbol. . . Eg. XLE
- It will most likely default to a strange-looking chart
- at the top of the URL bar we are looking for DAILY OHLC BARS (open-high-low-close). Later on, you can change to your favourite bells and whistles.
- on the left-hand edge is 5 icons
- click on the second ICON down
- high lighted is XLE blah blah blah will appear
- for now, scroll down and find “Murphy” and check it off. Way later you can change to what to whatever you wish
- click on the second ICON to close out
- click on the first ICON
- we will now be adding 2 moving averages
- scroll down and find Moving Averages-exponential.
- click on it for the first one to be 20 ema.
- click on it for the second one to be 200 ema.
- this is important because Stockcharts will always try to default to 20 sma and 200 sma.
- you should confirm the ema’s by clicking on the first ICON.
- stay on the first ICON and click on the far right of the name XLE to what looks like a wheel.
- scroll down to “other settings” and check off - extended hours - last price preference line - price labels - y-axis labels - if not done already.
- next move to “OHLC Bars Settings” -GREEN BOX for up Color - RED BOX for down Color.
- continuing on down, and find " Events" - check off Earnings dates, Dividends, and Predefined alerts.
- moving on down and find Alerts - should be default to a BLACK BOX line color.
- click on the Close box at the below.
- click on the first ICON at the top to close.
- Don’t touch the other ICONs for now until later.
- Back to the Chart
- Save the chart Layout
- click on the Bottom ICON (5th one down).
- go to the bottom and click on the GREEN BOX - “Save Layout”
- Give it a name/s to be used later.
- I chose "Simon ", you can choose your favourite name.
- the name of the layout should appear to the right of the 4th ICON.
- click on the 5th ICON to just show the current chart.
- sometimes the cursor disappears. Click on the ICON to the right of the word " SAVE " to what looks like a crosshair.
- when calling up a chart, confirm in the upper left-hand corner the ema’s should appear with the ticker symbol.
- if the SMA’s appear, click on the 5th ICON, click on the layout name (Simon), then click on the 5th ICON again to close out
36a. or at the top, click on the 4 square ICON, then click on the name Simon for the 20 / 200 EMA’s.
- the chart now appears ready for review.
- Later we will go over some scanning tools to find stocks Out of the Gate.
= = = = = = = = = = = = = = = = =
Training exercises via Simon Sez III
re: StockCharts.com
re: Barchart.com
Simplicity works best when following the two (2) simple SIMON SEZ III rules. Violate the rules you will pay a penalty.
https://www.investopedia.com/financial-term-dictionary-4769738
https://www.barchart.com/story/news/22359850/chart-of-the-day-go-daddy-go which chart is telling you what to do. This chart or Simon.
https://www.barchart.com/news/chart-of-the-day They are always posting charts that show that have long gone Out of the Gate and around the first turn. We DO NOT chase stocks. We let the prey come to us and not the inverse.
D I V I D E N D S -
Suredividend.com - It is supposed to be Free, don’t buy anything from them
https://www.suredividend.com/nasdaq-100-stocks-list/
https://www.suredividend.com/best-dividend-aristocrats/
https://www.dividendinvestor.com/
https://www.etf.com/topics/dividend
S W I N G T R A D I N G -
From Google.com search for SIMON SEZ III - will attach the below for information.
https://discussion.fool.com/t/simon-sez-iii-in-review/90365
Going to include the following :
Class - Ellevest matrix - I manage my wife’s portfolio via Simon Sez III
Class - SPDRs - I manage all of them plus XRT via Simon Sez III
Class - Stock Charts set up procedure - make sure you are using 20 ema (exponential moving average)
The Simon Sez - III Trading Method
A repeat - https://discussion.fool.com/t/tyme-has-come-today-in-beating-the-market/58989
Suggestion for stocks and ETFs (exchange-traded funds) to Swing Trade per Simon Sez III rules.
COST -
APPL -
AJG -
MSFT
CELH -
PLD for dividends. They own the properties that AMAZON leases as well as all Walmarts and a few others.
AMZN -
GBTC for sidebar action.
T E T T E R T O T T E R -
The Teeter Totter Principle is all about using a “Seesaw” to balance your Nest Egg’s cash and investments.
For each pair, you will be in one stock at a time. Simon will do exactly tell you want to do.
Get ready for a recession from 2024 to 2025 just like what happened from 2008 to 2009 so as not to lose any money other than a dollar or two.
ETF’s to Tetter Totter
SPXL / SPXS - have been swing trading this pair since 2006 - 2014 earning a substantial amount of money starting with a bankroll of 50K. 2014 - 2022 with 100K. 2023 to . ( your velcme to back check at your leisure ) . . .
SPY / SPDN - SPY issues a nice divi per quarter.
UUP / UDN
BITO / BITI
Chef’s choice on the rest of them from the list.
As you swing trade the TTs you will notice you won’t lose money other than getting into Head Fake.
Investing is a business and must be treated as such,
I asked a few Nurses and the cleaning staff who are managing their 401K’s or 403s. They said TransAmerica for the NORHWELL employees. The US Post Office is managed by BLACKROCK.com.
https://www.transamerica.com/investments-fund-center All of them are Mutual Funds. I guess they didn’t get the memo that ETFs are the best to own.
Going to show you one of their Mutual Funds ( TASHX). I am willing to bet that Transamerica is HODlers ( hanging on for dear life ). Look at the chart going nowhere.
VANGUARD is a better company to deal with. Some of my wifes ETF’s in her Portfolio are from Vanguard.
If you can, enroll in a Roth IRA instead of having a Standard IRA with your broker. You are better off in charge when you are in control.
As you will learn how to read charts. observe the prices going up and over the 20 ema. Going over, you trend after coming out of the Gate and then descend after the Finish line. The 20 ema is like a magnet. These charts are silent and yet speak volumes.
Using Horse Racing Analogy :
Out of the Gate = one bar after the price label to buy the stock Right it out all the way to the Finish Line.
At the Finish line = one bar after the price label to sell the stock.
S E C T R A D I N G R U L E S -
T +2 Settlement rules - must have available funds before buying back the stock.
For most stock trades, settlement occurs two business days after the day the order executes, or T+2 (trade date plus two days). For example, if you were to execute an order on Monday, it would typically settle on Wednesday.
https://www.investopedia.com/terms/s/settlement_period.asp
DO NOT trade options for they are a ZERO SUM game. Some will win while others will lose their Tommy Johns.
I wish you the best,
Quill - a poor church mouse scratching for a living as a Swing Trader for over 48 years and an Investor for 60 + years.
P.S. Two (2) of my students only swing trade APPL, V, and COST for several years. Checks the charts at 10:00 am and again at 3:30 pm and is done for the day.
P.S. The charts down below might show up in default mode. (ugly) At the top URL bar, change to OHLCBARS ( open-high-low-close.) https://www.incrediblecharts.com/technical/bar_charts.php
re. COST, AAPL, V, GBTC, AJG, MSFT, GDDY. if you want to be Healthy very Wealthy and Wise as a Swing Trader.