Thanks
I have been looking at YT videos and playing around with it…doc
BOIL about to hit $30. shoulda woulda coulda at 23.82 looking good now…doc
re: COST
Costco is rumored to climb at around $725.00
Also, there might be a possible Split,
Quill -
Yeah, COST chart is crazy good, nice job on your investment…doc
i bought MARA last week for 15.065 on the flag Quill. waiting for the flag to sell.
thanks mucho…doc
Doc,
It is only going get better.
Now, with your lunch money or allowance, buy ENB forever. https://www.enbridge.com/
ENB is a toll booth for gas to flow through there pipes from Canada to the Gulf Coast. Collect a nice Divi check Quarterly.
Enbridge Inc. is a Canadian multinational pipeline and energy company headquartered in Calgary, Alberta, Canada. Enbridge owns and operates pipelines throughout Canada and the United States, transporting crude oil, natural gas, and natural gas liquids, and also generates renewable energy.
Per Simon’s rules without doubting ENB has had 10 highs ( at each hi, is total profits.). this year so far. 2022 ENB had 13 highs all profit.
If you were to not to second guess and not watch, buy 1000 shares back in 2022. I’ll give you 3 + years you can make major bux…
Charts don’t live people do.
Simon & Co. never lies, head fakes and all.
Take TECH, 3 plus years and now it is over 2.2 million dollars per Simon Sez’s rules.
Enjoy and have a Merry Christmas and will see ya around the campus.
Quill - Simon - Lucas
1 Like
I’ve been watching TECH for a buy and will add ENB. Thanks…doc
The media keeps talking about bubble and pull back yet we are in one of the craziest bull market runs of all time as borne out by the indexes, stocks running up wild and the bonds dropping. I wonder how long into 2024 this will carry. What say ye oh wise sages of the Technical Traders forum? IMHO…doc
1 Like
Lakedog,
I would be interested in getting that scan setup. I can’t figure out the settings but reading on the settings has been educational. I would like to scan and learn (also pick) from real scans. That being said I am fumbling around buying bits here and there and making some profit. I purchased MARA last week using Quills setup on stockcharts for 15.065, XLE for 82.556, in (152.43) and out(154/34) of WMT for profit, in and out of SQQQ for loss (Beachman article and didn’t use SS technique), in(11.29) and out(11.39) of AGL for small profit/even, bought (34.81)and sold (35.82) HAL for profit, in (8.51) and out(8.55) of DAKT for breakeven. Holding MARA and XLE waiting for flags per SS rulez. I’m settling down to the SS rulez because the best profit has been with SS quite honestly. MARA is up over $8 and XLE $2.25 approximately trading off of SS. The hardest thing is to follow the rules because I look at the price of bitcoin and oil in the morning and quite honestly if they weren’t up I would consider to sell my positions to lock in that profit. For the amount of time I am spending doin this the profits are good. Mind you I am buying small amounts, but the profits are up in the 4 figures range. I am taking into consideration that I am learning this SS style during a historical bull rise…doc
2 Likes
Happy to see what we can work out. I am juggling a few balls in the air, so it may be in “starts and stops.” First question, are you looking to try Stockcharts or TOS systems, or both?
You cite the SS rules and that is a major difficulty and may not make it possible. That relies on Stockcharts special labels (I assume, I don’t use), and those are generated from their proprietary algorithm and that isn’t a specific scannable component. However, they basically follow a Zig-Zag indicator which might be a usable surrogate. Quill can answer if you can actually do such a scan specifically for SS as I am sure he has tried in probably both TOS and Stockcharts.
Regardless, if you can outline your other criteria, can try to manipulate. Writing out components in general helps a lot to organize writing the actual scan. Alternatively, if you can’t specifically scan for the SS final “signal” you can try to trim your herd down by other criteria and make it easier to visually scan a smaller number. Are you looking for stocks in a specific sector? Uptrend or downtrend? Specific RSI or Stochastic or EMA? Price level or Volume? Etc. Give me some more specifics and we can try to work out a usable approach. But nothing is easy, whatever comes out will not do all the work for you, just streamline it some.
Lakedog
1 Like
Heads up to those using TOS for scans. TOS has two modes: Actual money and Paper trading. You can only use their “studies” (TA indicators) in Actual money mode. I googled this problem and discovered that this has been a problem for years. So be aware of this issue if you’re learning to use TOS scans.
Quickbuck
4 Likes
Doc,
I re-read your post and have a different comment and perspective. I wonder if scanning is really the issue for you. I get the impression you are not short on potential targets, rather managing them. Scanning will not help that, may make it worse with too many targets. Remember, scanning doesn’t tell you which stock to buy, it tells you which stocks are solid candidates per your criteria. I’m still happy to try and help work out a scan if possible for you for the sake of learning (both of us), but want the expectations appropriate. For the record, took a quick look at Stockcharts scanner and they do not have ZigZag in their tools. But TOS does, although, the problem with labels and zigzag is that they are lagging indicators and will repaint. That is why I haven’t messed with Hats, Smiley Faces, Price Labels, etc. And why they are not a primary indicator in my mind.
I also get the impression you struggle with FOMO. That is always a tough one for everyone. No one could blame you for taking profits, or some profits at least, especially in MARA. It popped out of a squeeze on the 28th and is now on it’s 17th day post-squeeze. John Carter, if I remember correctly, likes to only let them run for 8-12 intervals and starts to harvest. Two solid gap-ups, 52 week high and it’s trying to form a hanging-man doji candle today (to be determined). Those things would make me think twice. Yet, it has just broken a 3-year strong resistance level. Interesting chart.
Not fair for me to say what to do as I don’t have skin in the game. You could watch. You could take profits (you imply you have a 30+% gain right now). You could set a tight stop (doesn’t guard against a gap-down). Or you could consider taking some profit, maybe half and keep the rest running with a stop loss on. Regardless, one has to suspect it is getting close to a pull back and remember, you can always consider getting back in. There is no Wash-sale when you take a profit.
Lakedog
Right you are sir. There are multiple handicaps in Paper mode and OnDemand mode, but you can do Money just not buy. Plus, building the same criteria in a “strategies” category of studies let’s you loosely backtest using their FloatingPL indicator.
Lakedog
Thanks Lakedog
regarding MARA I’m trying to trade on the SS rules. Same with XLE. I follow a service for my pension plan and they tell you when to buy and sell based on computer analysis. I have been with them since the early 90’s and they have been reliable. That system sacrifices 5% at the top and bottom to always catch the rise and always miss the crash. So far they have done a good job. This SS system that Quill uses looks similar with there possibly being a sacrifice at the sell and buy points but catch most of the rise. That is what I like about it. On strong up trending stocks, if you catch most of the rise and miss most of the devastating drop, then I am good with that. Anyways, I am interested in scanning because like right now I have cash and some possibilities but no definite entry candidates.
I just heard the bell so the market just closed. I feel like the last 30 minutes was a buy opportunity for most traditional investors as this dip is just in front of the Santa rally we will see maybe starting tomorrow morning. On the SS system the 50 some stocks/etfs in my list there were no buy points flashing that meet the criteria i am looking for : 50 day sma positive, 20 day sma above the 200 day sma and market trend positive to name a few. I have no idea what stock criteria to use because I’m not averse to even buying things below $5. I just missed the SERA rise as it was not on my radar. I just started reading about CRSP and missed that entry down in the 55 range. Thanks again and thanks Quickbuck for the information. I’m not paper trading so good to know…doc
1 Like
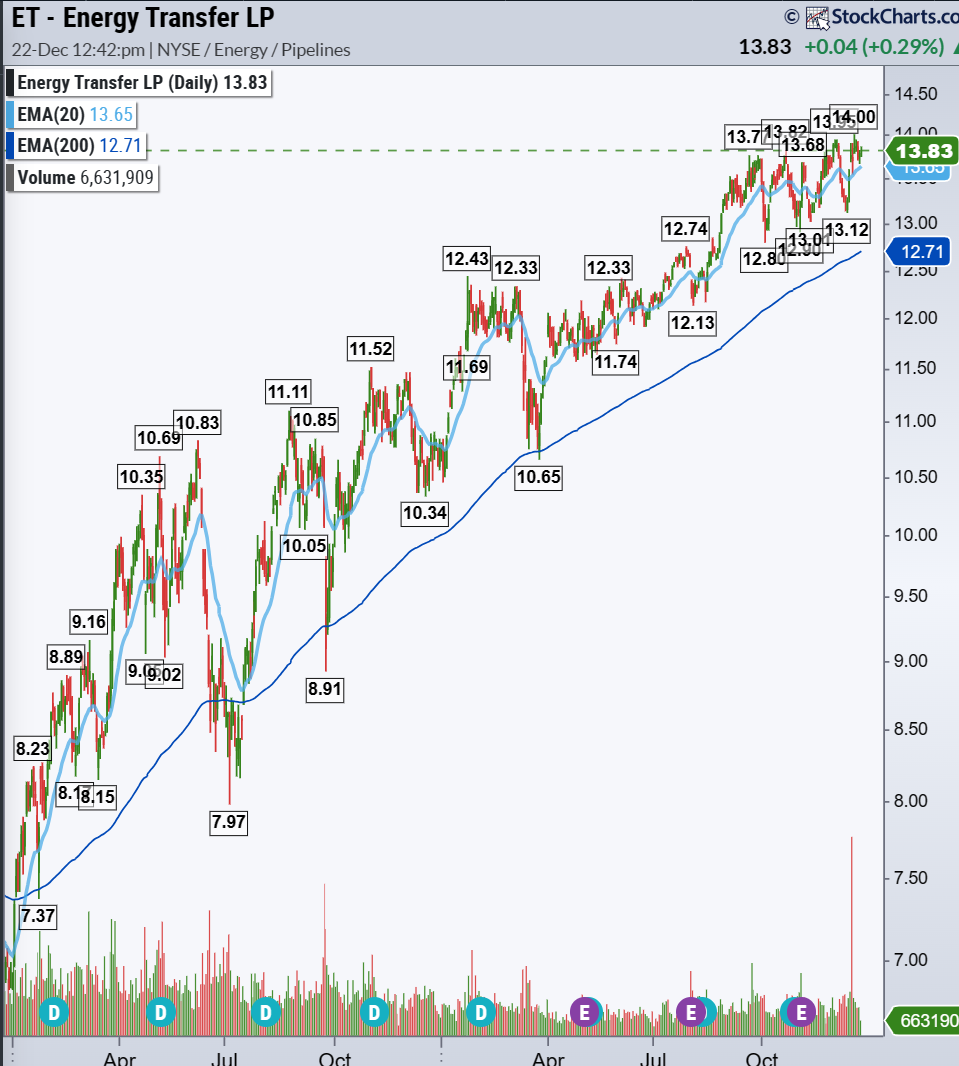
Quill, i was talking to my father in law who is retired from major company in the oil field. He was telling me about some companies and one he mentioned is an oil pipeline company that is a big company. I looked at the chart and wanted to point it out to the group. The symbol is ET…doc
edit:
1 Like
That is a limited partnership Doc so be aware of the tax implications. I can’t believe how volatile boil has been
Andy
BOIL KOLD both be all over the place. I still have MARA and XLE. No flags yet and nice profit. I’m watching ET for entry point…doc
re BOIL - you should have bought on 12/13/2023
re: KOLD - you should have sold on 12/13/2023 first
Must own one or the other, not both as in Tetter Tottering.
re: ET vs ENB - take ENB when it time to buy - ENB pays a better divi check.
ET appears to be channeling ( in a tube) 'tween 13 and 14 dollars depending upon what kind of trader you may be. You be wasting your time energy and money.
Swing Trading it doesn’t matter.
I’d take ENB over ET.
2 Likes
Quill,
Not so. ENB’s fwd div yld is 7.51%. ET’s is 9.06% @ Yahoo and easy to confirm by pulling the data.
1 Like
Thanks Arindam, I knew ET had a good dividend but had not looked up ENB…doc I like that pattern that ET has had for 2 years…doc