To see a larger view of the chart, click on it.
Doc,
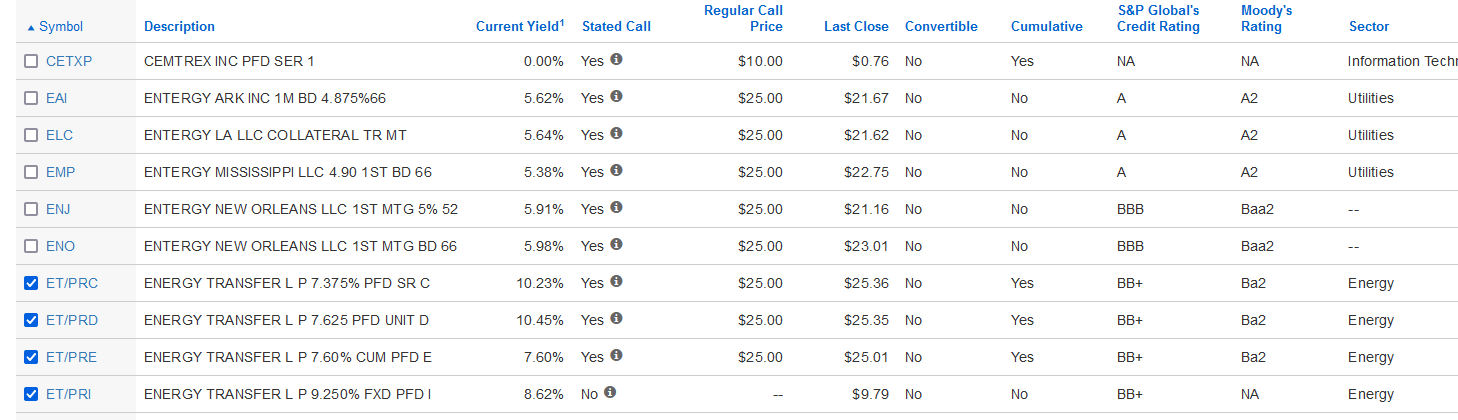
Take a look at their preferreds. There might be some opportunities there as well.
Disclaimers: I’m long ET-C.
To see a larger view of the chart, click on it.
Doc,
Take a look at their preferreds. There might be some opportunities there as well.
Disclaimers: I’m long ET-C.
Quill,
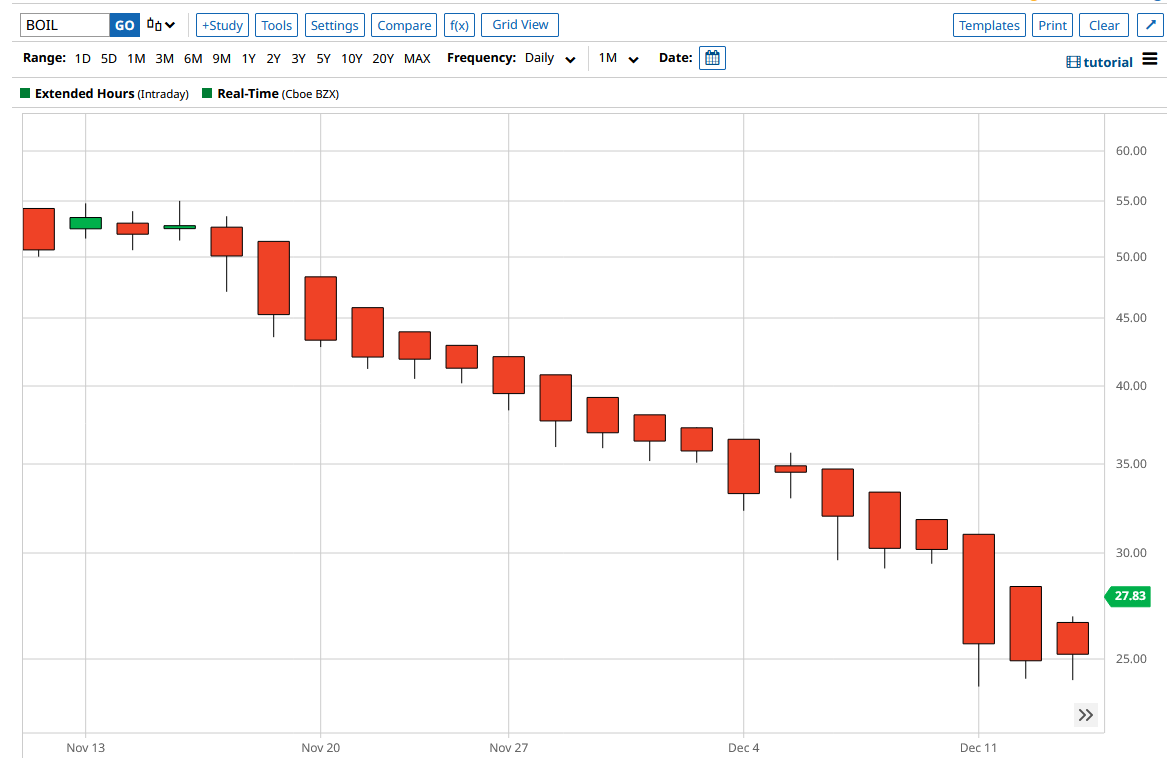
Here’s a bare bones, HA chart for Dec 13 with BOIL at the hard, right-hand edge. There’s no ‘Buy’ signal to be found it.
But if one had been using Hollow Candles and Candle Pattern Analysis, then maybe a buy could have been done at market open on the 14th. But not before.
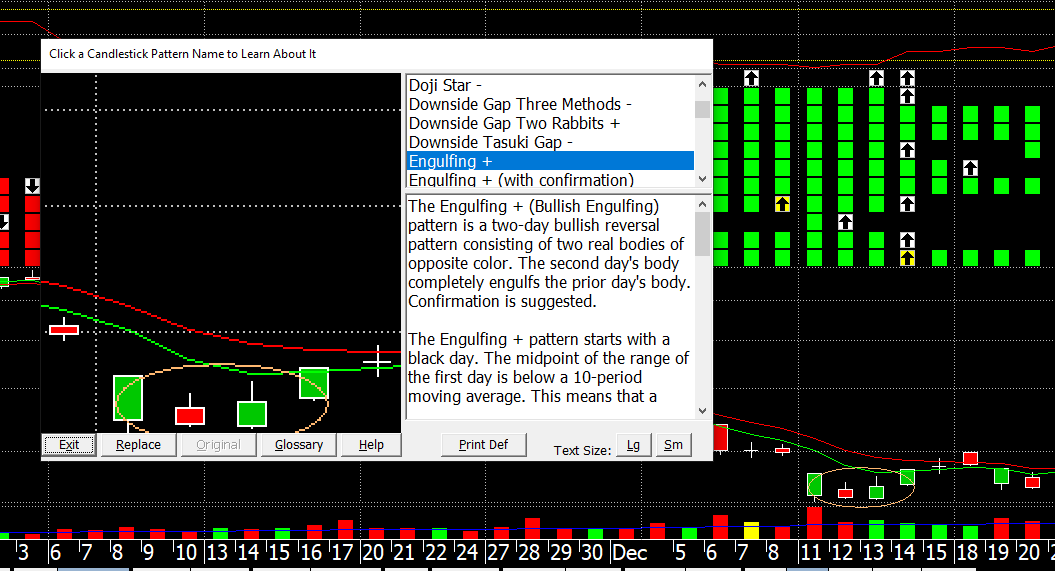
So, what’s the name of the candle pattern that forms on the 13th? Here’s the answer.
Lastly, note the last sentence in the first paragraph. “Confirmation is suggested”. Therefore, a cautious trader would follow your ‘Wait One’ rule and would be entering on the 15th, not the 13th.
You’re on a comuter screen all day, from market open to close and can zip in and out of positions as it seems to make sense for you to do so. But that’s not the audience for whom you developed the Simon trading system, or --at least-- not the audience I’m concerned about, namely, them with a day job who need --or want-- to pull a few bucks out of markets for whatever reasons, but on an End of Day basis as EOD “swing traders”.
Charlie
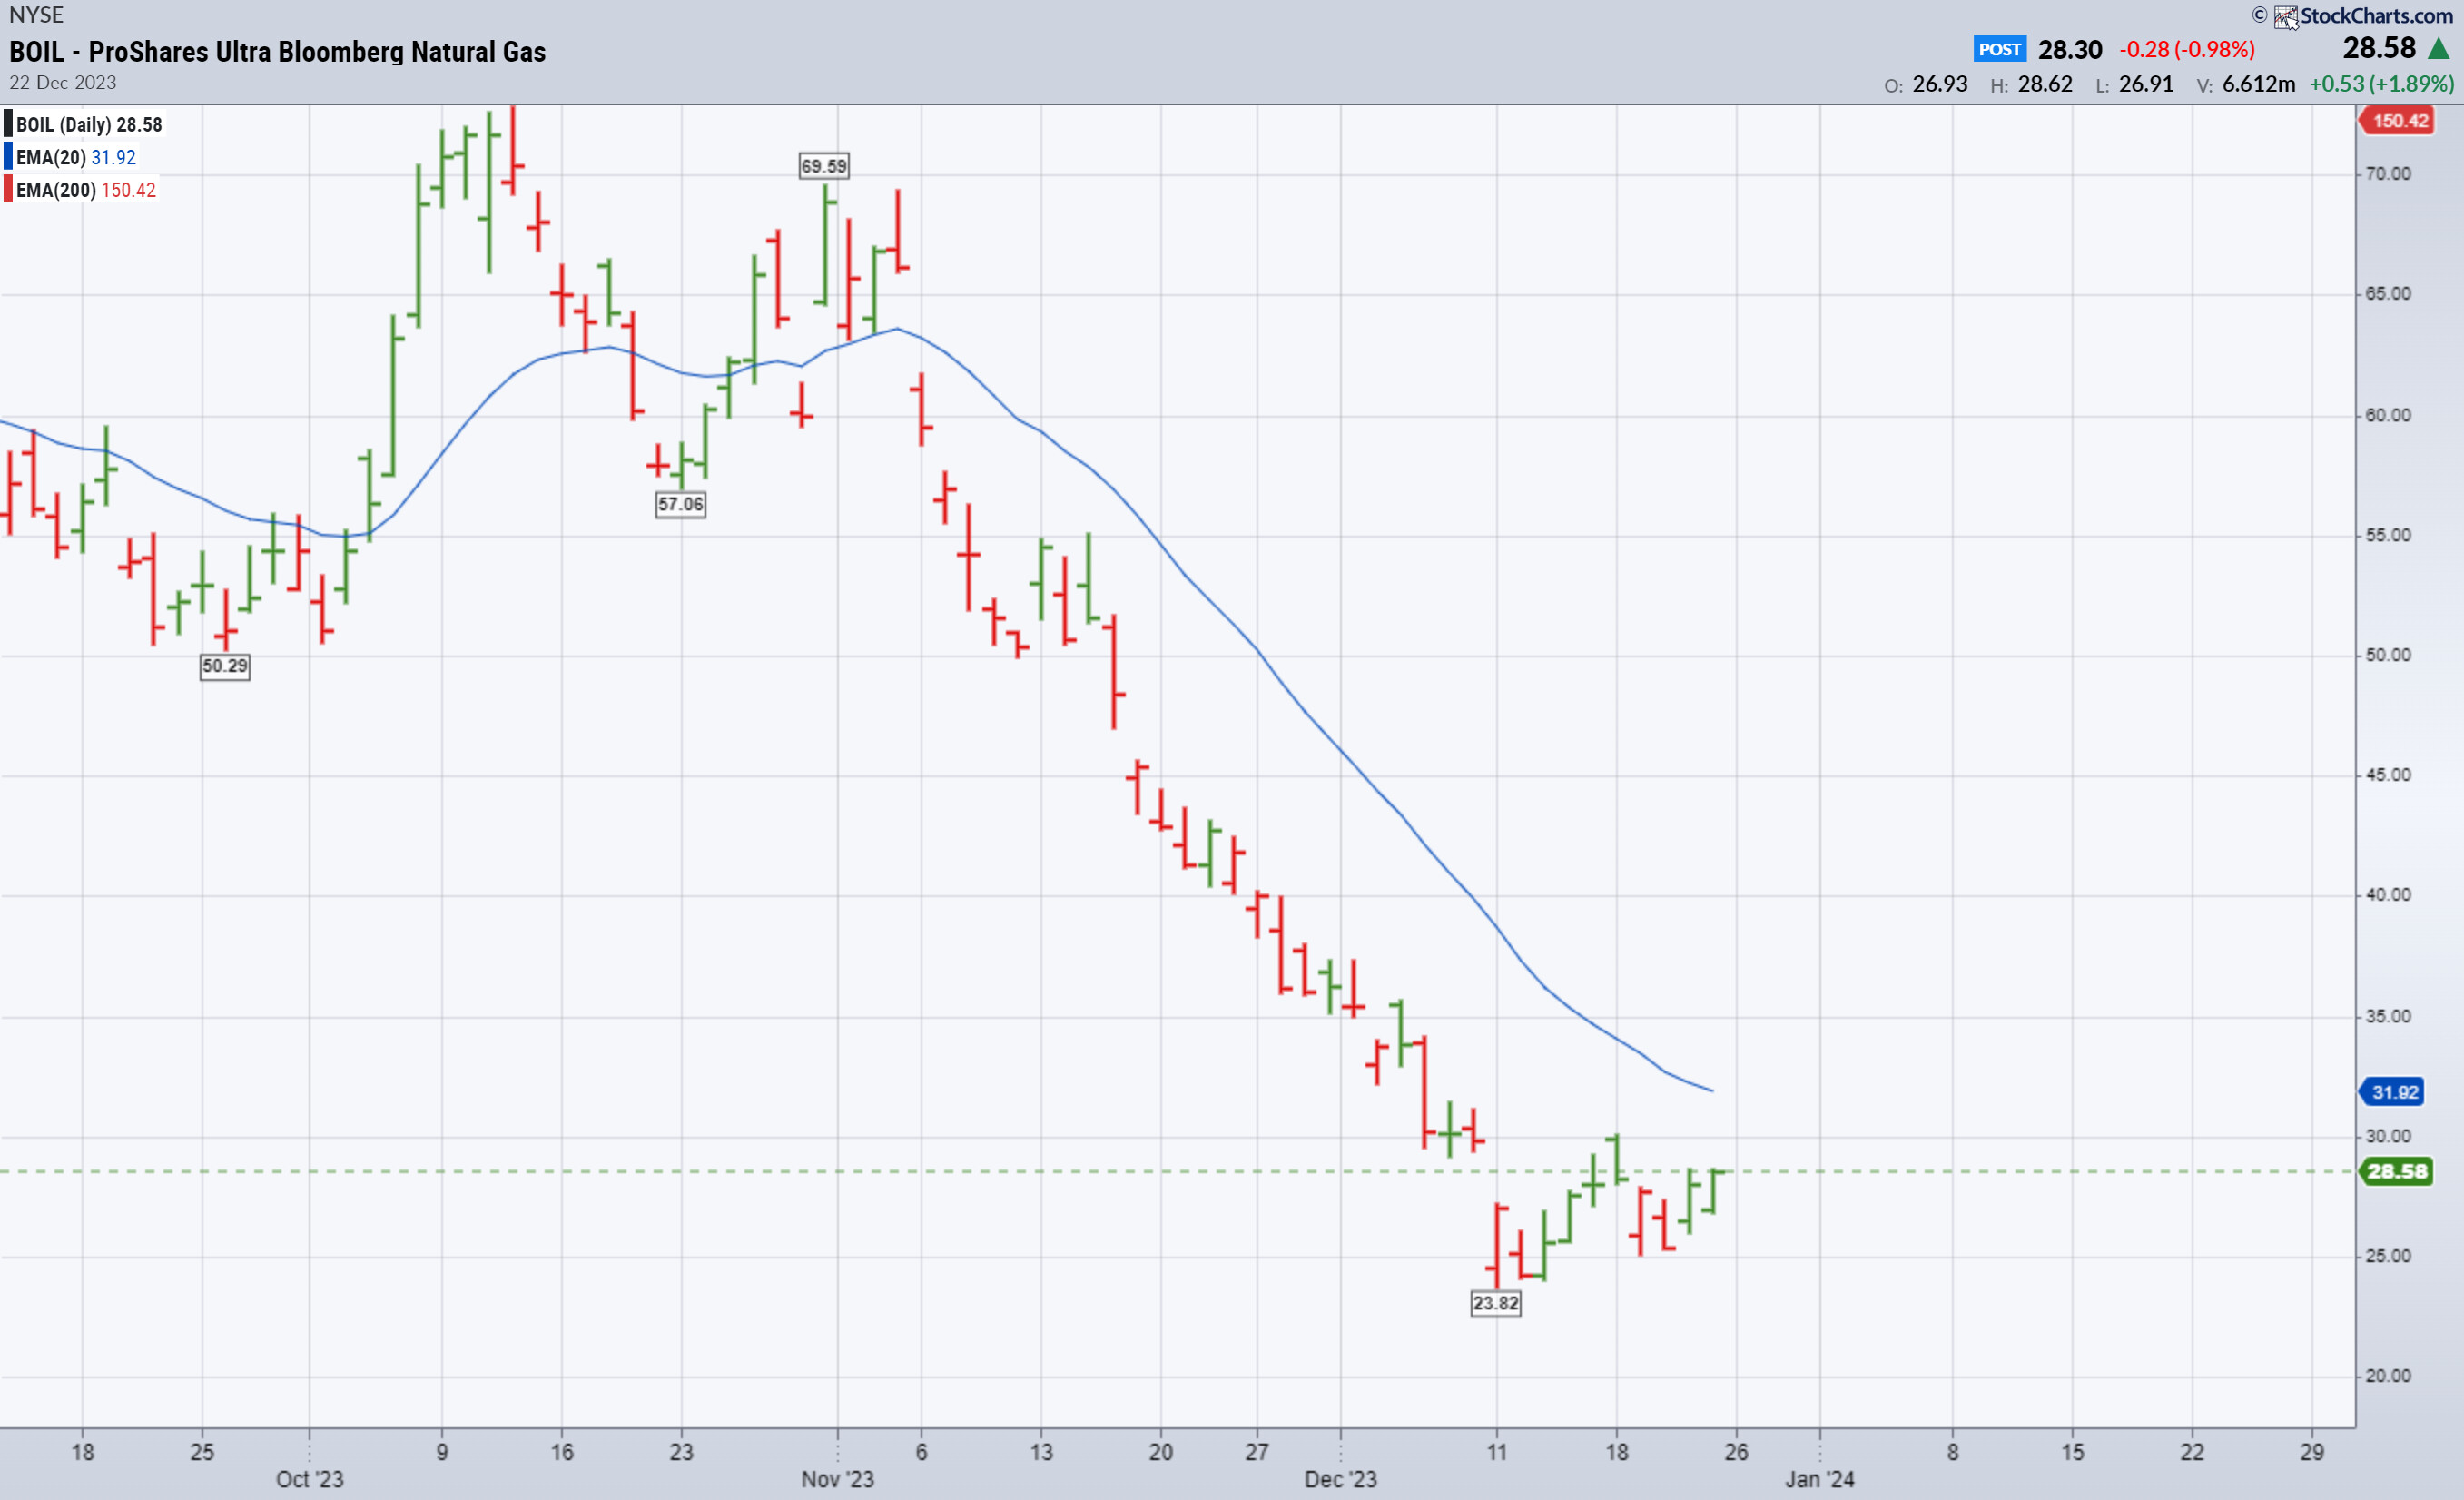
Charlie, I do show the buy flag on the 13th for BOIL and it would be up $5 so far. Of course the buy would have occurred the next day…doc
Quill, i bought XLE on a flag and held it until the flag today for a 2.70 profit in less than 2 weeks. I also bought MARA and it is up some $12 in less than 2 weeks. It was all I could do to not sell it and lock in that profit, but there was no flag yet so I held it thru the weekend until we see what happens Tuesday. I have been buying small positions and my regret is that I have been buying small positions LOL. The hardest thing so far is finding stocks…doc
edit: its hard to let the winners run
SHOW ME THE MONEY !
ET now pays 0.3125 cents per share quarterly
ENB now pays 0.6496 cents per share quarterly. Almost twice as much as ET.
ENB meets my requirements when it comes time to collect a check. ET does not.
I look for dollars and cents not Yields. I think we went through this theory.
As I said before, ET is stagnant while ENB is climbing .
Charliie,
If you may recall, I had mentioned about the modified Simon III rules out of the gate.
Flag plus one would have been a buy, however a RED bar popped up there, so we had to wait for the next day for a GREEN bar to appear on the 13th.
This modified appearance only happens once a blue moon. Also, very rare does a RED bar happen two times in a row after the flag.
If I entered on the 15th, I would be losing money.
To make an informed decision of whether to buy or sell or wait only takes 10 minutes and move on.
Most of my time is managing other portfolios such as Divi’s and SPDRs.and Ellevest.com for my wife. One hour in the morning and one hour in the afternoon 3pm to 4 pm. In the evening I read research reports.
Traders have cell phones, and they have to go to the bathroom at 10 am and sit on yea throne sometime other than truck drivers that are on the road.
The G-mail app is constantly sending messages all day long.
The Simon Sez III modified is being applied here. If you want at your leisure, go backward and review every bottom label to see what Simon says to do. I barrel through the SPDR’S every 3 seconds per chart.
Took only a few minutes to review all the ARK’s such as ARKK
Quill,
I keep forgetting that you use look-back lows and look-back highs as trading signals. But like Zig-Zag, they constantly repaint. Therefore, I make no use of them.
Sold MARA today for almost double up on the sell flag. Thank you Quill…doc
excellent - good job - now we wait :o)))
Doc,
I’ll second what Quill said. Good job with locking in profits on MARA.
It’s still trading above a MA pair, which normally offers price support. But given its weak fundamentals, its unlikelihood of near-term profitability, and the fact it’s trading near ‘fair value’, getting out was problably The Right Thing to Do.
Thanks, I’m happy with the move obviously. I will now watch for the next entry point. The evidence is strong that it and most things bitcoin will march higher seems clear with this bitcoin etf thing happening imho…doc
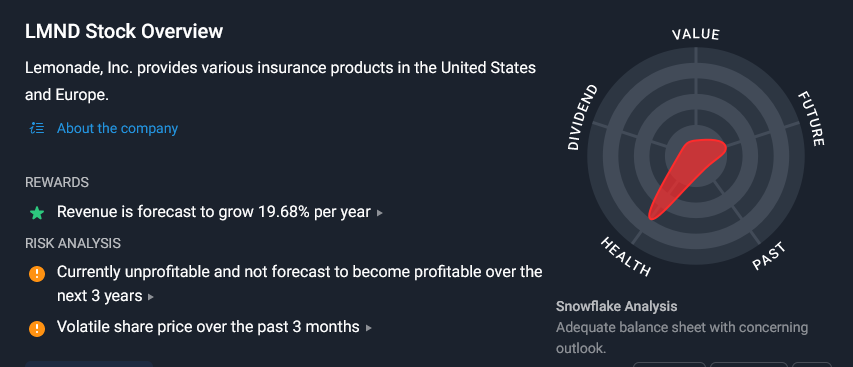
Thanks guys, this discussion is really helpful with swing trading ideas and process. I really appreciate it. How about LMND as a swing trading stock? Per SS, seems like there was a buy signal yesterday on 01/02.
LMND sucks majorly.
Its chart isn’t promising, either.
But PLMR might be worth a look.
Followup to ‘Growth’.
Go to BarChart and enter LMND in the ticker box. In the left-hand column, find ‘Competotors’ and click on it. Roughly 30 stocks will come up. Of those, only three are turning a profit today. Clearly, the industry is being sold down. So that becomes the reserch question.
Why is the Multi-line insurance industry being sold down? And do you really want to be trying to catch a falling knife?
Yeah, at some point, a bottom will be put in. But until the macro work is done, trading off of alone technicals makes no sense at all, given that they’re pretty sucky.
Charlie
.
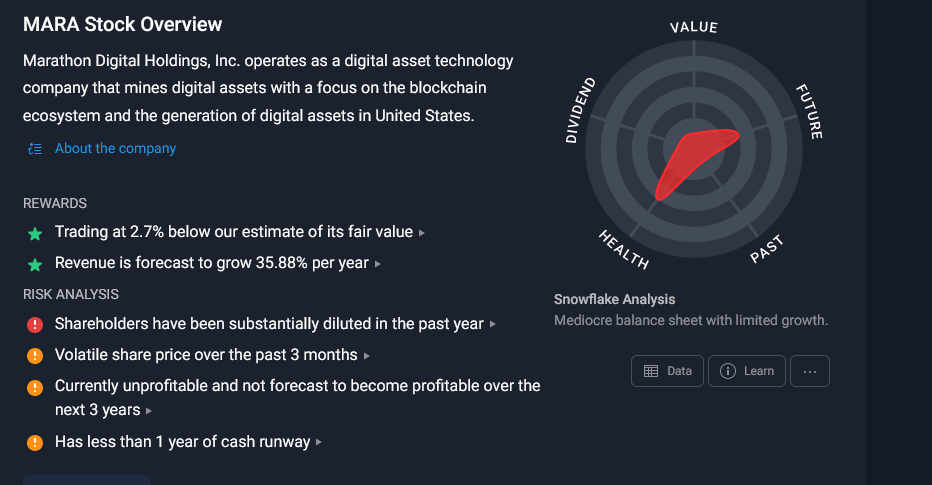
Thanks Arindam, really appreciate it. What do you use for Stock Overview (the 1st screenshot)?
Growth,
The first screen shot is from a fundie website called Simply Wall Street. Not cheap at $20 bucks per month. But using it to screen out questionable companies has saved me thousands of dollars and tons of grief.
If you’re an “average” investor running just a couple dozen stocks, then you’ll find the research tools offered by nearly every broker quite adequate. But if in a research session you’re looking at a hundred or two companies, you need something faster. SWS’s “snowflakes” allow me to do a quick Yea or Nay. From there, I can dig deeper on their website and pull up earnings trends and forecasts, fair value estimates, etc.
Edit:
Trading can be done on technicals alone. Our dear forum hosts claim that investing can be done --should be done-- on fundamentals alone,. (They’re wrong, of course. But that’s a post for another day.) The smart way to invest or trade is using both. Or as John Murphy likes to say,
FA plus TA equals RA (aka, Rational Analysis)
First of all I want to say that I agree with Charlie. I’m still learning how to do this trend trading and he is one sharp person on technicals who is an excellent teacher. The chart below that I am looking at tells a different story regarding trend trading LMND. Someone could have made some money on this stocks movements up and down. This is from stockcharts.
PLMR also flashed a buy signal as you can see above. Just giving you a different perspective/view…doc
Doc,
Much thanks for your kind comments. But let me offer a disclaimer. I don’t have a method to teach. Like everyone else who has ever posted here, I’m just someone struggling to deal with an ever changing market as best I can.
Next point. Let me repeat something I said in another post. “A way of seeing is also a way of not seeing” In particlar, Don’t torture a chart into confessing to what you want it to say.
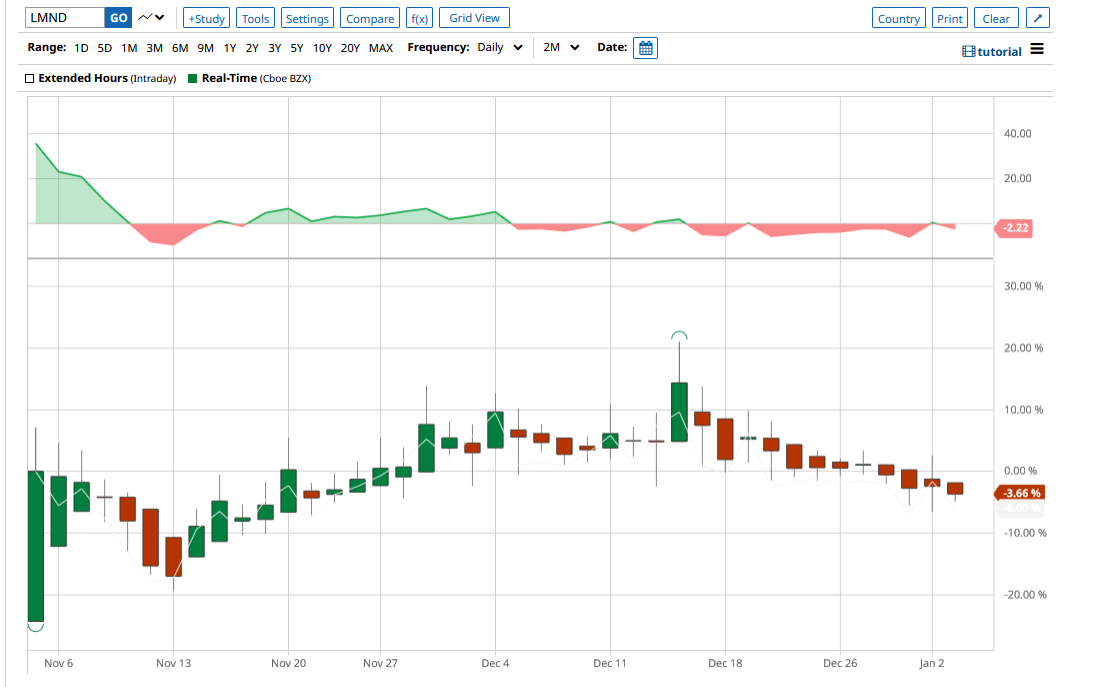
As I chart LMND, in one view there was no ‘Buy’ signal for it yesterday. In another view, there was.
So, which should be trusted? Which could be acted upon?
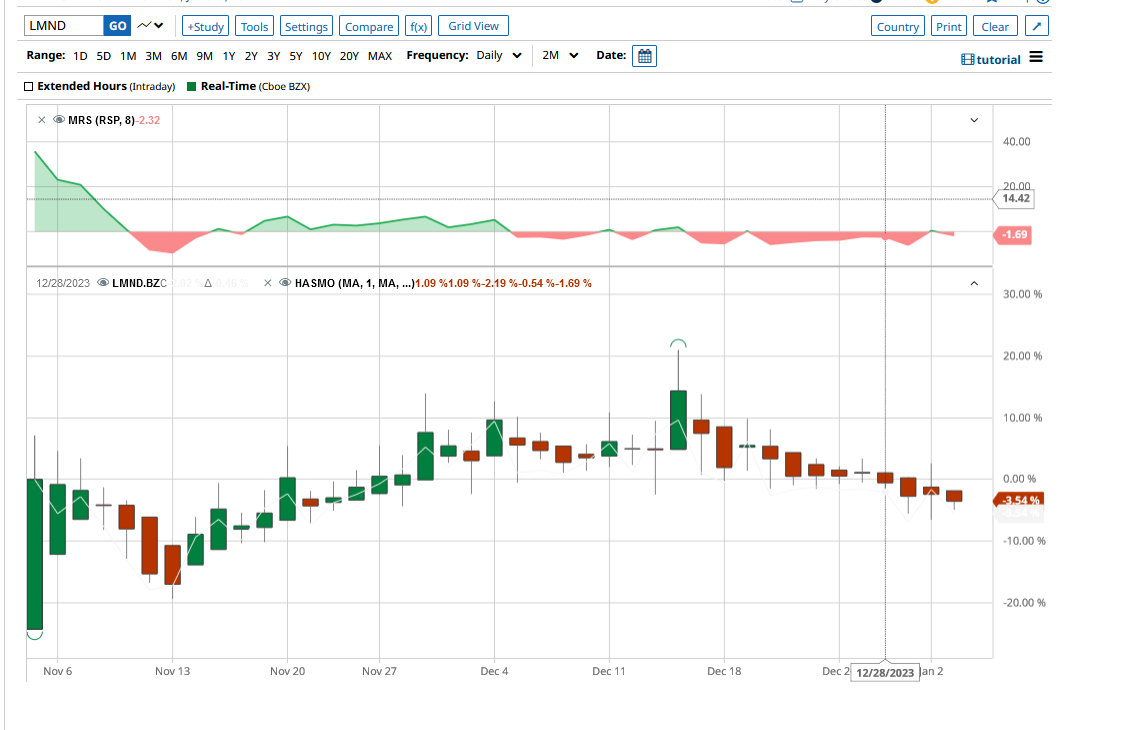
Let’s consider the second chart. Per Quill’s rules, a ‘pre-buy’ signal has been flashed that triggers the 'Wait One’ rule. But today’s red bar cancels yesterday’s green 'pre-buy signal. End of story. Also, consider the stacked MAs. A strong downtrend is clearly in place.
Now take a look at a third view, one with a 3-month lookback.
The past two months for LMND have been chop, chop, chop. Clearly, it’s ‘ranging’ , not ‘trending’. That’s not a stock you want to get involved with. Now look at fourth chart with weekly percent bars and a one-year lookback. Clearly, LMND is rolling over, with Support --the horizontal red line-- being 50% below current prices.
I could add a dozen more, differently configured charts. But the majority vote among them would be PASS. Add to that info LMND’s sucky fundamentals, and there’s zero reason to be tracking that stock. It’s a POS “story stock” of the sort the Motley Fool likes to hype. But it’s nothing a serious investor would give a second thought to.
Charlie
Thanks Charlie for that in depth look at LMND and the buy flag. Now thats a learning point…doc