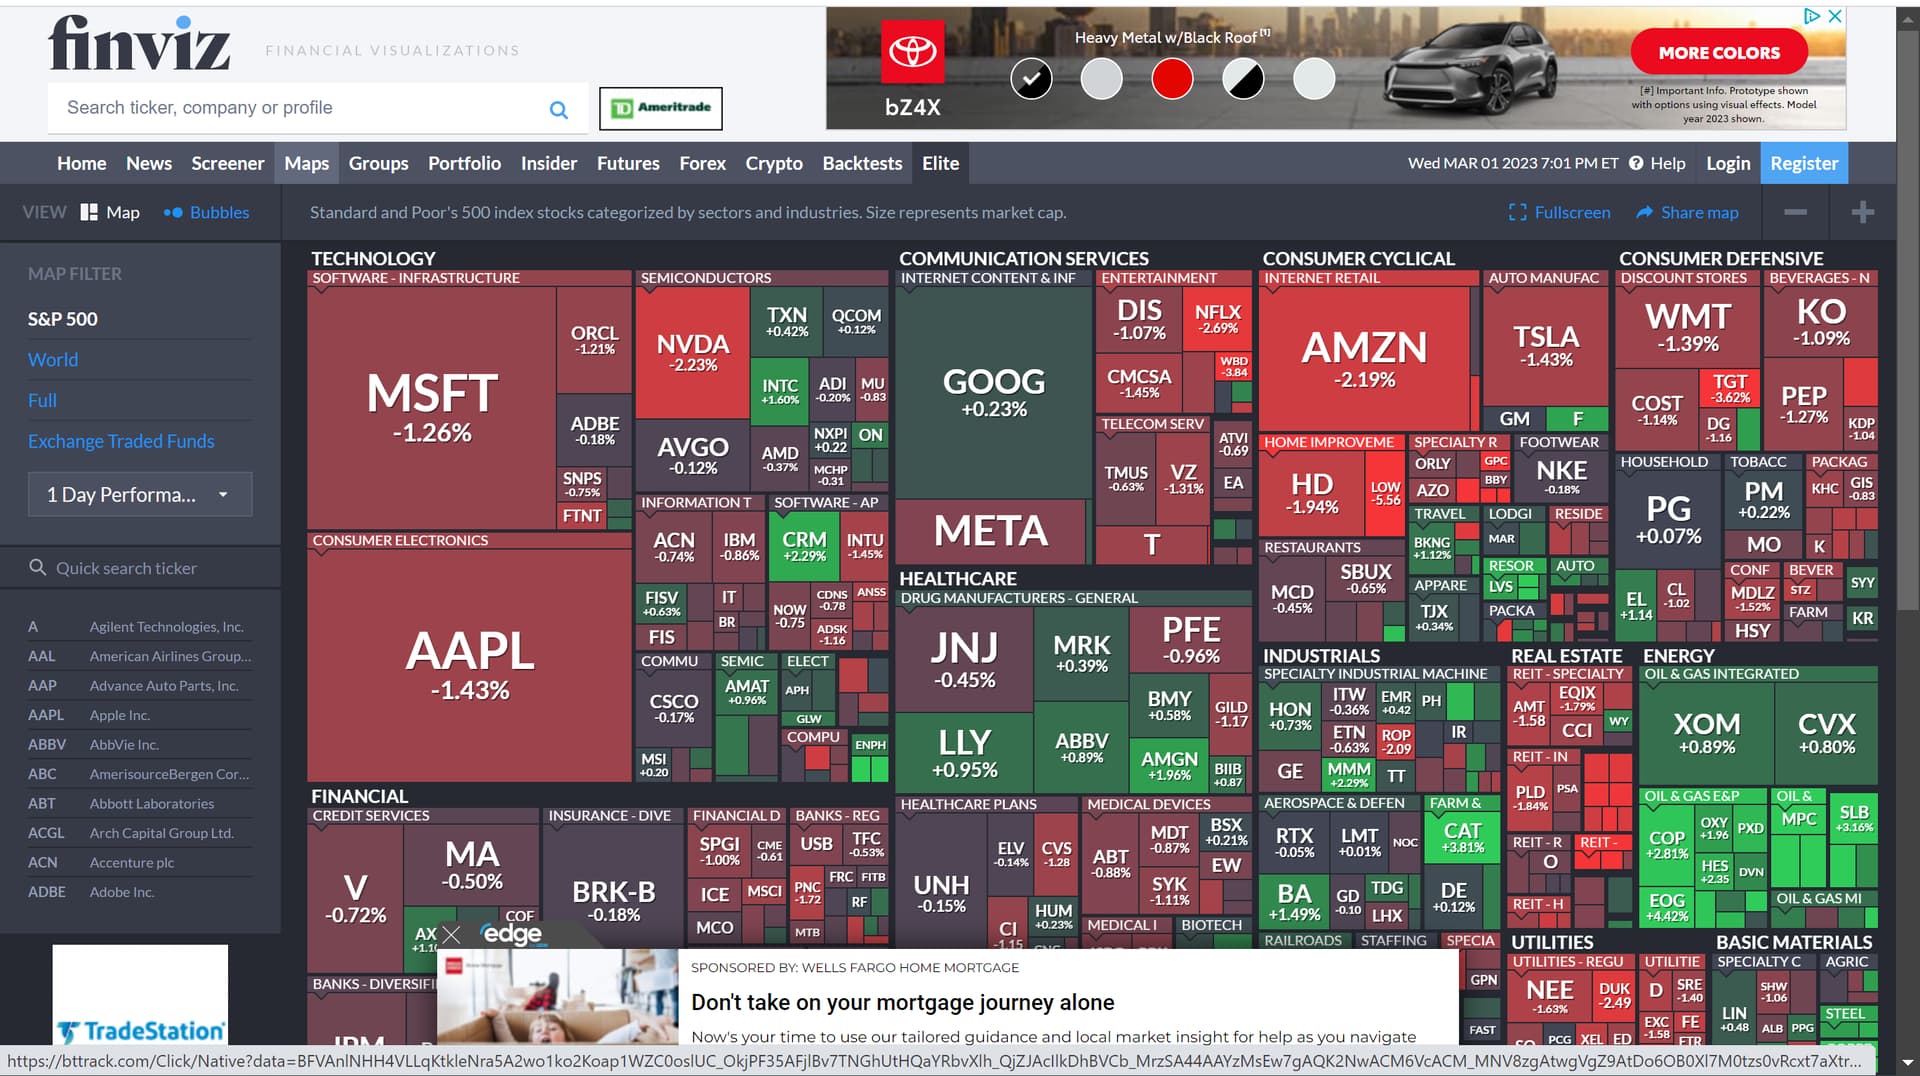
Hi Peregrine, The heat map for Oil is turning green.
All of the oil stocks in the green box are turning up. So maybe they are starting to break out. I have been looking at UCO and it looks like it is in the start of a new uptrend.
I think I will go long tomorrow.
Andy
2 Likes
How can oil prices rise in a recession? Has to be a short term investment. Looks cyclical to me. Better to buy the dips.
2 Likes
Right Paul oil is cyclical. It’s more a play on Oil according to the charts and what is going up at this time. Not a long term investment. Could be with the opening of China we could get a short bump up.
Andy
OILK is giving the unhappy smile…doc
1 Like
that is the 5d Doc, spread that out to the 2 month.
Andy
I guess I don’t understand why the signal would change based on the time frame…doc
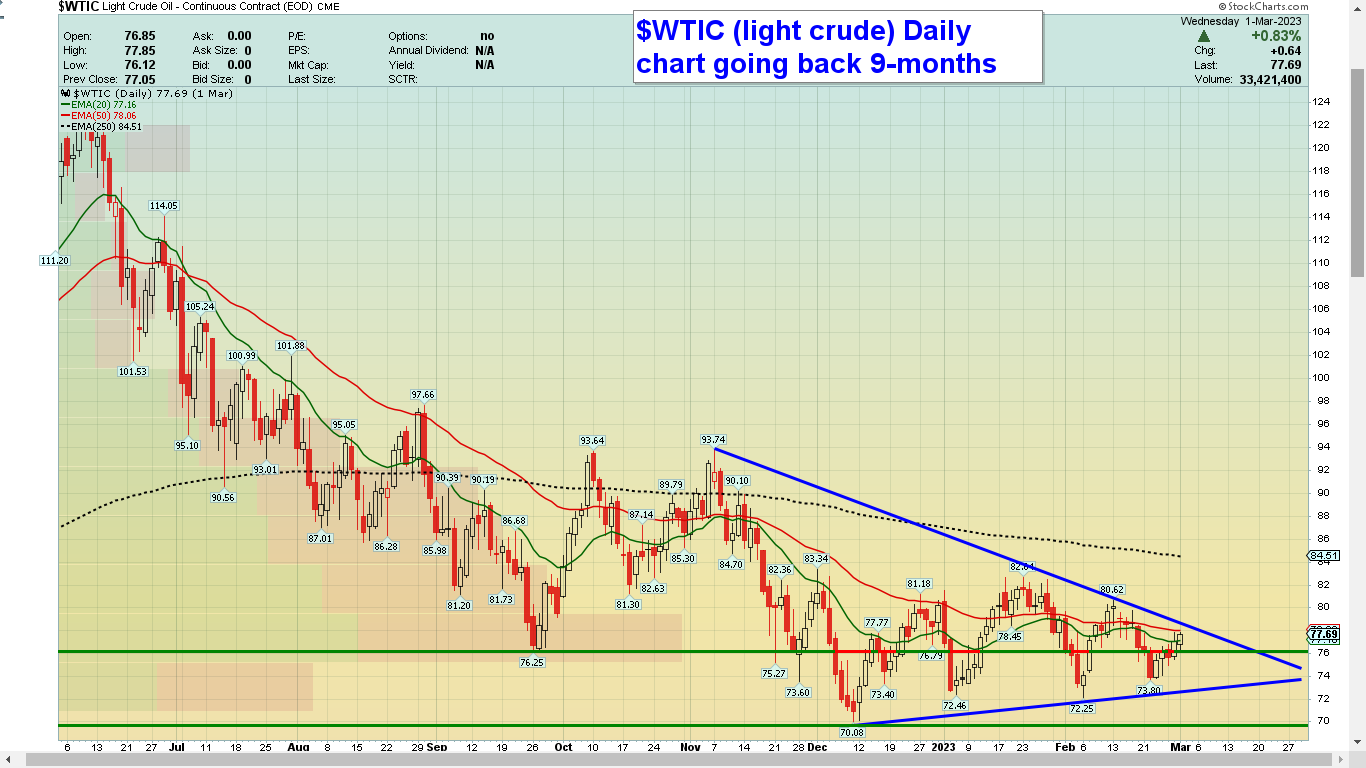
Yes. Very good eye. I’ve been busy making $$$ in $NATGAS and I was looking to play oil soon and it looks like we’re almost ready for a big breakout on the daily, and bigger leaps and bounds from the tiny breakouts showing on the weekly daily charts.
p.s. An “all clear” siren will blast if and when the EMAs on these charts have bullish crossovers to the upside. Still, I’ll be playing oil on any breakout from the daily.
1 Like
Here’s a bullish article interview with the head of Chevron about the price of oil in the second half of the year…doc
For What Its Wirth (barchart.com)
1 Like
This is how I see it Doc and I am trying to learn so I may have it wrong.
Well the shorter the time frame than the high and low are much more condensed. So when you have 5 days your high and low will be within those 5 days. (Smiley and Frown faces) If you have 2 months it shows you the trend better because it is longer. I like to look at 5 days, 2 months and 1 year. 1 year to see the trend better, 2 months to see if I want to take a position and 5 days to see what it is doing right now. The 5 day will really whip you around and unless you are trading intraday, which I never do, it really isn’t useful for me to make decisions for longer trades. But if I was a day trader I would definetly use them. Those smiley and frown faces can keep going for a long period of time if you are looking at 5 days and are in a down trend or up trend. That is why I am trading the Tetter/Totter method, following the trend, at least trying to. But remember Doc I really am just a very new beginner and others can explain this better.
Andy
1 Like
Thanks Peregrine, I have been playing Boil for about a week now.
Andy
2 Likes
Yeah, I’ve been lightening my load of $BOIL all the way up.
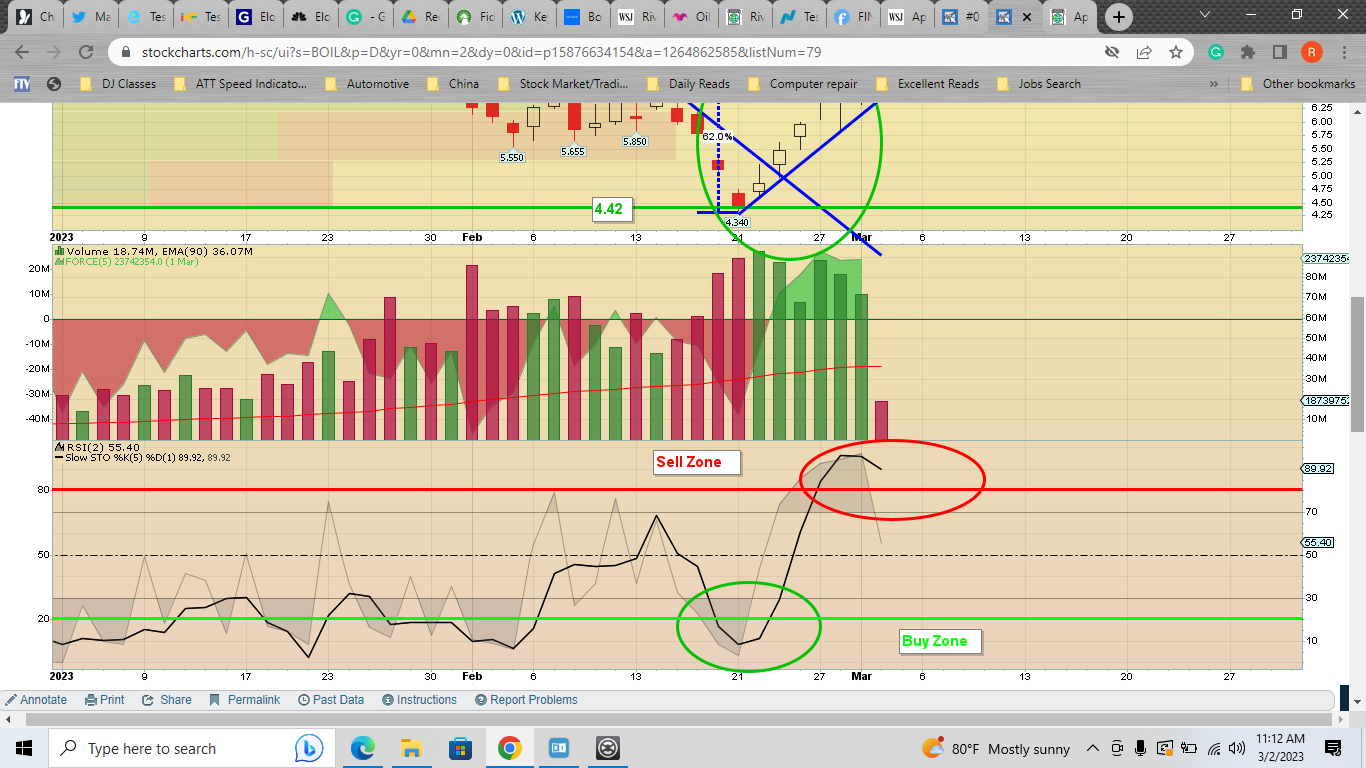
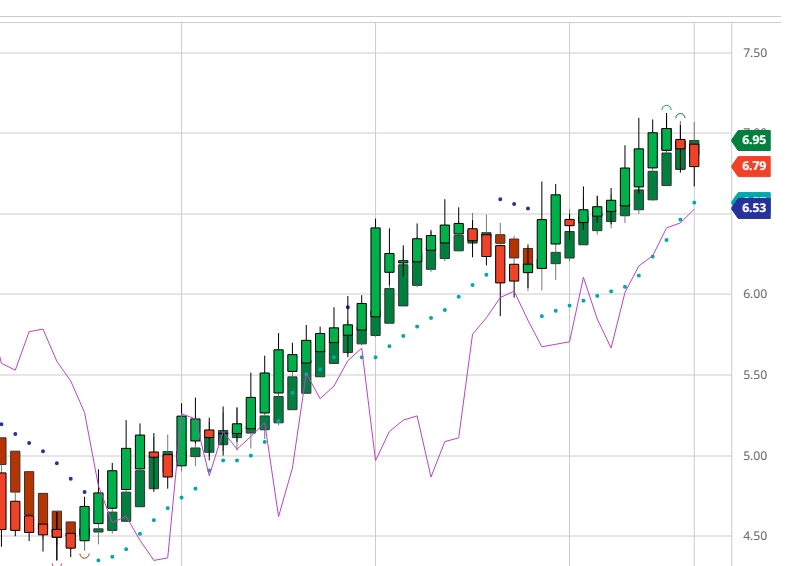
I’m down to 10% of my original stash of $BOIL and I keep ratcheting the stop/loss upward. I want to say my S/L is $6.25 today. Something like that. Right under that trendline on my daily chart for $BOIL.
By the way, I’ll lay the bottom of my chart here too as the Slow Stochastics 5,1 I have customized is saying we are now “overbought”.
I’m monitoring $KOLD, the inverse of $BOIL.
p.s. My last shares of $BOIL are at at averaged down price of $4.42, so a little below that $4.61 line of support we blew out. These last shares are part of my first “nibble” up and down. I’m getting into rhythm with how this bad boy trades.
Here you go, look from the bottom of my $BOIL chart. I was selling $BOIL everyday this past week and last Friday. Big trade for me. Best of the year, so far.
I’ll bring up $KOLD next - which I’m monitoring. Will nibble on just one share to follow along in my account. Forces me to start thinking “money management” right off the bat.
1 Like
So I sold my $TSLQ today for about a 3% gain. I sold some more $HAL for about 2% gain.
I’m still 67% in that $HAL trade carrying a 3.73% gain at this moment. I think I can eke more out of this trade.
Loads of tinier trades in Biotechs which are way too dangerous to invest in unless you have F/A minds like Rob and physician who have a feel for such dd.
I trade the pictures. I make sure the underlying business has something to crow about. Some of the best biotech ideas on this board are scraps Rob throws us.
Anyway, here’s the $KOLD chart. Notice the trendline and horizontal supports held today:
Bottom part of my $KOLD chart. Here’s the big tell on $KOLD: volume. And volume is very underwhelming and sleepy at this moment.
1 Like
BOIL looks like a sweet trade, up close to 50% from the signal…doc
2 Likes
Doc, what time increment is your chart?
Next question: I know the SARs study you’re using (I use it on 39 minute charts) but I’ve never seen a chart with two candlesticks one below another.
What’s the name of that candlestick study and what’s the thinking behind it? Maybe I’m not looking close enough.
I cut a piece out of a 2 month chart. It’s Heikin Ashi and Quill / Arindam use them and I looked them up and liked them…doc
Heikin-Ashi Formula: A Better Candlestick (investopedia.com)
2 Likes
That two candlesticks is because of barcharts. They get mixed up a little. If you go into settings and turn the bartype off , apply, go back in and turn back on it will fix that.
Andy
Looks like you have been in Boil for quit a bit Peregrine, nice trade. I got in later but on a 2 month chart it looks like it is right up against the 30 day ma. If it breaks through it could be on the way up further.
I have been looking to play this boil and kold. We will see.
Andy
1 Like
What MA do you use for the HA line Andy…doc
1 Like
Been making bank of $HA over the past week. Nothing outrageous. My last third riding out this new uptrend will have a new stop/loss insuring gains from this last bit. Meanwhile:
$OILD and $OILU are two I will play oil exploration. Very low volume as these are newer ETFs which are 3x leverage. Again, if you cannot daytrade or multitask quickly, these two are not for you.
I am using the 30 day. I have been reading Sam Weinstein and he proposes in investing only in stocks that are over the 30 ma. I am playing with it trying to understand it. I think if I was going short term I would use the 5 ma and the 7 ma for a crossover like Puru Saxena proposes which is eerily close.
Andy
2 Likes