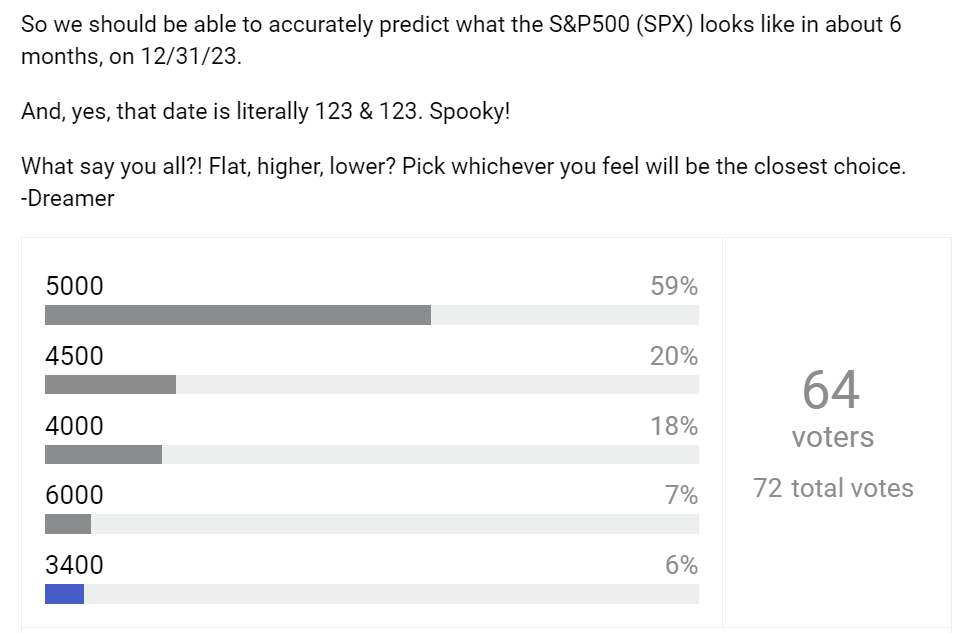
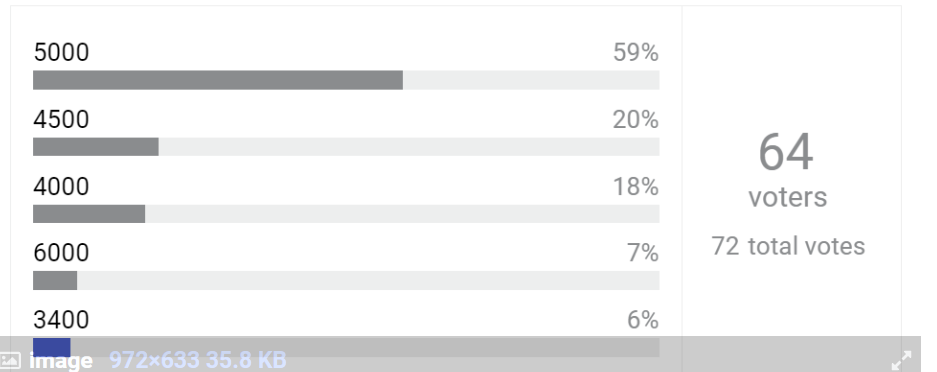
Here is what I wrote last weekend on this topic…because it has possible implications for where the SP 500 ends the year…
JPM’s large quarterly options hedge
In order to better understand how markets might close out 2023, I am keeping track of the monster, quarterly options hedge that JP Morgan has placed.
The JPMorgan Hedged Equity Fund (JHEQX) has over $16B in assets that include a basket of SP 500 stocks as well as their options hedge. They place this hedge every quarter…end March, end June, end Sept and end Dec…with an eye to where they expect markets to trade and close the forward quarter. This hedge allows them to limit downside losses in their equity portfolio, while capturing upside gains if stocks rise. The hedge limits upside gains a bit, however it gives their high net worth clients more predictable returns over the long term. There are actually 3 JPM hedge funds that do this…the other two are smaller, satellite funds in the family.
The mechanics
Warning : This section includes more detail on how the options trade works. Skip past the next few paragraphs if it is not of interest to you.
The JPM collar trade, as it is generally referred to, involves an options collar. To enter the collar, the fund sells 3-5% out of the money (OTM) calls and buys 3-5% OTM put spreads (buy a 3-5% OTM put and sell a 20% OTM put). The premiums from the option sales are used to fund the cost of the option buys.
If the market goes higher than their call level (strike), they lose money on the hedge but their equity portfolio gains value.
If the market goes lower than their first put strike but stays higher than their second put strike, they gain value in their calls and puts which offsets losses in their equity holdings.
If markets go much lower i.e below their 20% OTM put strike, losses accelerate because both the hedge and the fund’s equities lose value.
As we approach the end of the quarter, they allow the existing collar trade to expire and they enter into a new collar to cover their stock exposure for the following three months. They often spread out these actions over the 1-2 weeks prior to quarter end to get better pricing and to disguise their intent.
Market impacts
This JPM hedge is massive…typically involving 40-50k options contracts, each contract representing 100 units of the SP 500 index (SPX ). You can use your brokerage website to see this trade in place…look at the open interest column in the options data tab for SPX .
40,000 options contracts of SPX = 4,000,000 shares of SPX = $1.71B…if my math is right.
So this hedge involves $1.71B in calls + $1.71B in puts + $1.71B in more puts.
The sheer size of the hedge position increases market volatility at the end of each quarter when the fund resets its strategy because the new calls and puts need to be, in turn, hedged by market makers that enable these trades. Market maker hedging results in buying and selling of units of SPX and their underlying equities.
Even during the quarter, JPM might be inclined to adjust their hedge position to reduce losses, resulting in more market movements.
Traders and large investors have been increasingly watching where JPM places their hedge because it gives them a trading range for the SP 500 within which they might be able to “safely” put money to work.
I find this information useful as:
- I map out my own portfolio plan for Q4 and 2024.
- I develop my hedging strategy either at the portfolio or at the individual stock level.
Hedge levels vs market performance
For March 2023 , JPM placed their hedge at 4,065 Call, 3,600 Put, 3,060 Put. The SP 500 closed at 4,109 that quarter.
In June 2023 , their hedge was at 4,320 Call, 3,885 Put, 3,280 Put. The index closed at 4,450 that month.
For Sept 2023 , their hedge was at 4,665 Call, 4,210 Put, 3,550 Put. The SP 500 closed at 4,288 last Friday.
And for Dec 2023 , JPM has placed their hedge at 4,515 Call, 4,055 Put, 3,420 Put. About 30k options in each of the three legs…so far.
Wall Street wants markets to wrap up the year at or close to 4,515 and they see maximum downside risk at 3,420.