Woods Trades $TSLA for $NVDA

There’s an inverse $ARKK ETF I will find and add to this thread. That sucker had to have jumped last week.

Ethereum’s “proof of stake” upcoming hard fork has crushed the prices of $NVDA GPUs on eBAY.

I’m not sure METARites and most analysts understand just how big this hard fork will be for Ethereum (and even Cardano which was designed from the get-go with proof of stake)and how it will temporarily hurt and depress prices for used $NVDA GPUs.

That said, Woods might be right or wrong here. Too early to tell.

Barron’s headline: Cathie Wood Sold Tesla Stock and Bought Nvidia After the Chip Maker’s Tough Day

By Al Root
Updated Sept. 2, 2022 8:52 am ET / Original Sept. 2, 2022 3:39 am ET

https://www.barrons.com/articles/bed-bath-beyond-falling-fou…

The ARK Innovation exchange-traded fund (ARKK) bought almost $32 million in Nvidia stock on Thursday. The fund also added about $9 million, combined, in Exact Sciences (EXAS), Ginkgo Bioworks (DNA), and Teladoc (TDOC).

Wood funded the sales mainly with Tesla (TSLA) stock, selling about $32 million worth of shares. The ARK innovation fund also sold about $9 million worth of Compugen (CGEN) and Signify Health (SGFY).

Daily chart looks for $ARKK, $NVDA, $TSLA, and $SARK (the aforementioned inverse $ARKK etf)

$ARKK daily chart (broke down through trendline support 3 weeks ago)

https://schrts.co/zzaXXCXe

$ARKK weekly chart (it won’t take much more to fall to a horizontal resistance set during the worst of early COVID)

https://schrts.co/vNCcXxgU

$ARKK monthly chart (that down channel looks like the Stairwell to Hell.)

https://schrts.co/BUYvUjwg

$NVDA daily chart (blew out a horizontal support this past week)

https://schrts.co/vemnFstc

$NVDA weekly chart (shows the long bullish trendline break down this week)

https://schrts.co/dcaSdVst

$NVDA monthly chart shows another horizontal (this one a long term horizontal "support) in the $125 area which is where I’d look for some temporary halt if $NVDA continues to fall. This is a company I want to buy and hold. But the charts have to firm up.

https://schrts.co/xtqGCcpm

$TSLA daily chart

https://schrts.co/BBwbmiYu

$TSLA weekly chart

https://schrts.co/wSuitQJX

$TSLA monthly chart

https://schrts.co/MBCNuERc

$SARK daily chart

https://schrts.co/mjWaddEt

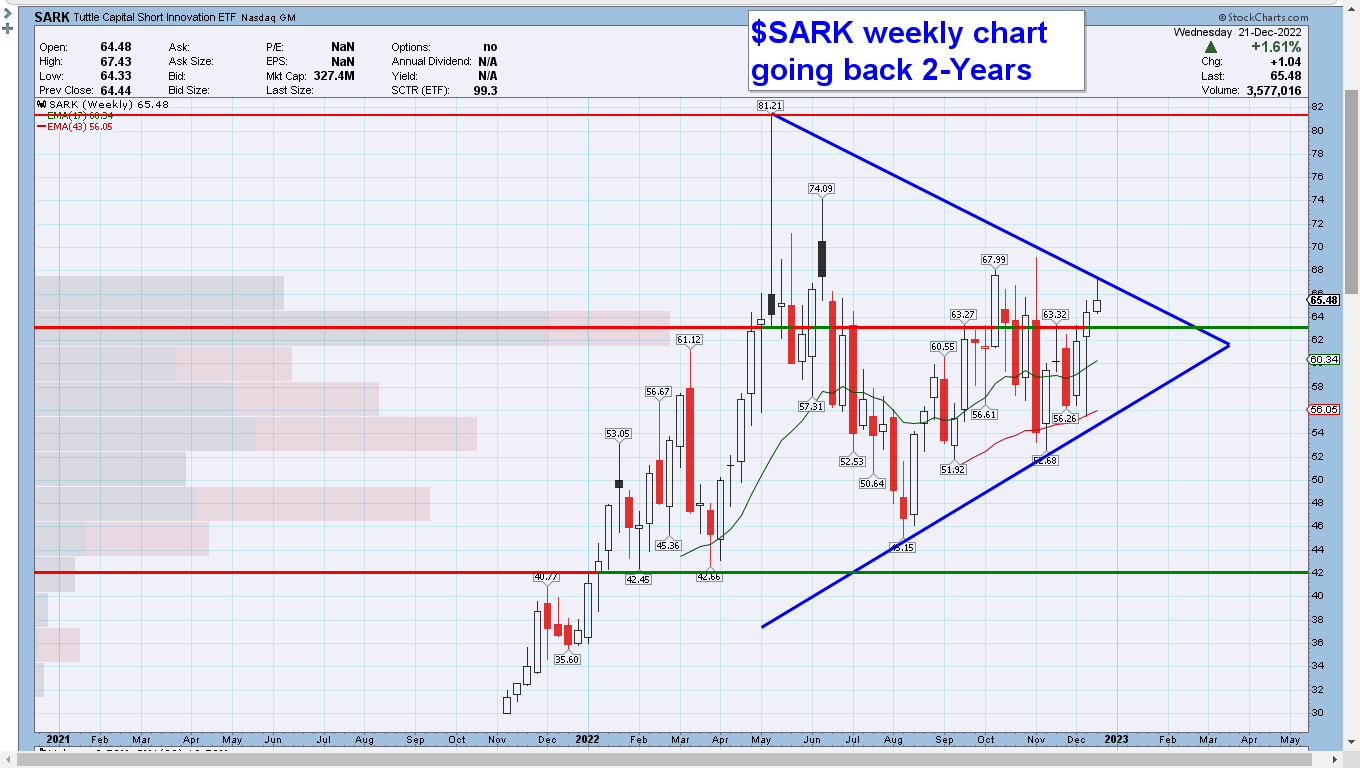
$SARK weekly chart (faded bullish breakout on this chart)

https://schrts.co/uEyKvySz

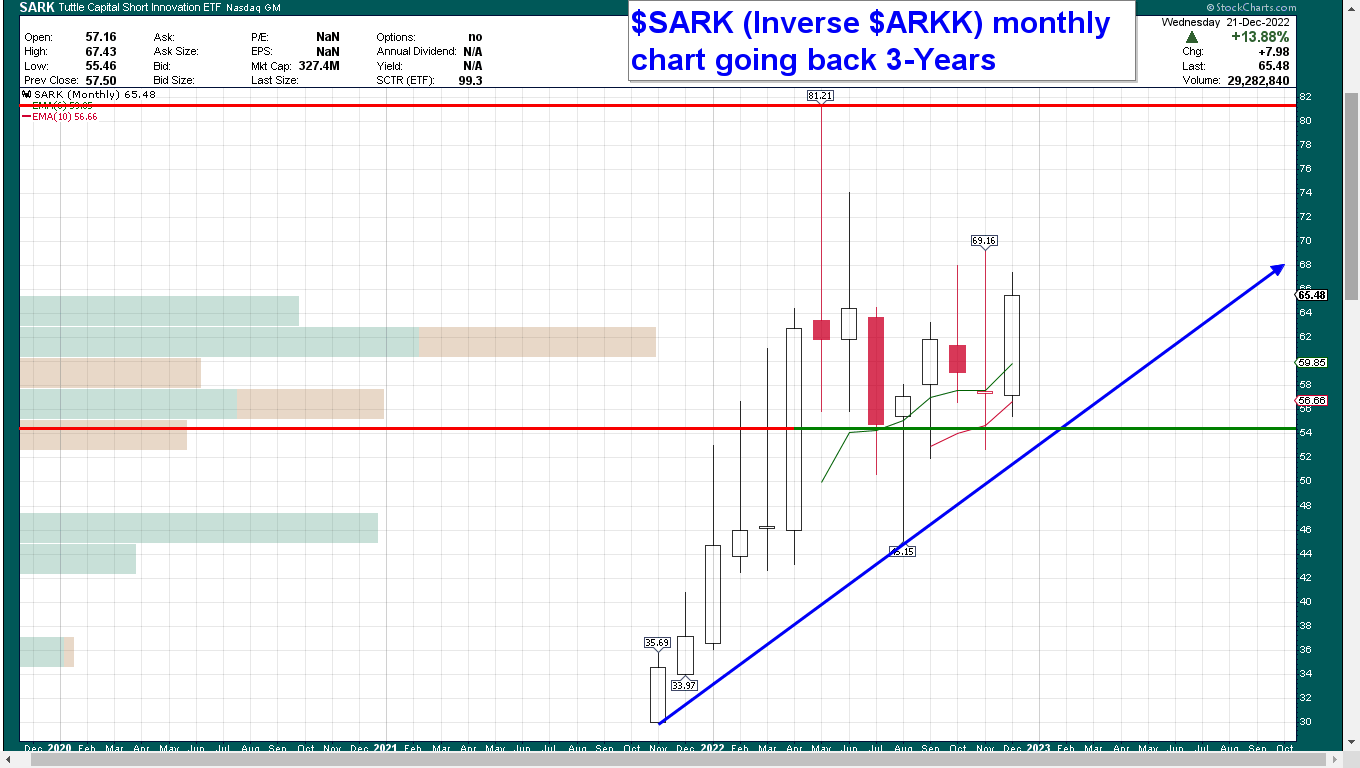
$SARK monthly chart

https://schrts.co/VdhuFJGn

$TSLA daily, weekly, and monthly charts. $TSLA now trading at a 25-Month Low


$NVDA daily, weekly, and monthly charts. Weekly and Monthly charts show faded breakouts.


$ARKK daily, weekly, monthly charts. $ARKK hits a new 5-Year Low on the monthly chart.


I think that is really old news. Here is the recent.

Here is October LOL.

Andy

1 Like

A look at the Cathie Woods inverse ETF, $SARK, at end of day yesterday::


$TSLA end of day yesterday, WED, 21 DEC 22 If you notice the day chart, Tesla has fallen to a new 52-Week Low every trading day of this pat week. I’ve been watching for a downtrend reversal to play to the long side, but the volume sticks for the past four red days are above average 1.25 x to 2.00 x. Panic selling on $TLSA is still here.

The analysts who have supported Musk the longest on Twitter are now making loads of noise, finally, about inventory, falling demand, strife at factories, and a CEO who doesn’t lead. Gerber (pushing for a board seat), Gary Black, Gali, Electrek, Insideevs, etc. This is the worst of times for Tesla since I’ve begun following it.**


Look at that bearish crossover on the $TSLA monthly chart, i.e., the 6 EMA crossing down over the 10 EMA: that happened at $270-$275 back in April. Had Woods simply used a simple EMA (faster moving that SMAs) she could have avoided a 50% crash on $TSLA shares - unless she did trade them in for $NVDA and vice versa.

Regardless, price/action on charts does not lie. $SARK is way up for the year because Cathie Wood and $ARKK are way down. Were she using either my weekly or monthly charts and paying attention to whether the EMA crossovers are bullish or bearish, she could have avoided months of losses. Very simple. Trade the stocks which are near their upper ranges. Those are the leaders now. P/Es for the NYSE and NASDAQ will continue to fall. It’s not just Tesla, it’s everything which doesn’t have real earnings, where debt continues to burrow holes in the financials.

2 Likes