Simon Sez 3 Real-Time Tracking and Learning

6/27/24 Trade of the day for community analysis based on SS3 rules
This is a Rule#1 buy based on the Barcharts OHLC/Candles but not based on the HA charts. I will show both.

Here is what I expect people to say was wrong.

  1. the TSI does not confirm, the green is not quite above the red yet

Here is the HA chart, which says it is not time yet…


What might be wrong

  1. the HA bars are not yet green
  2. the TSI green is not above red, but not below it
  3. the DPO is not green.

We know the OHLC is “faster” than HA so get in early and make more if it works, and also get out faster. But he who hesitates is sometimes saved.

Thanks for all constructive feedback.
Pete, trying to learn with small amounts of real money.

EDIT: updated regular candle chart. Annotated with a green buy line and a note for price. When you see those red arcs above the price, that is where I manually added that symbol to remind me where ALL the smiley faces were. Will buy green arcs on bottom when frowny faces appear.

2 Likes

IGV review. I bought IGV correctly and when it felt bad after a decline of enterprise software stocks. But it was right by Rule #1. I can’t figure out why I sold it. I don’t see any sell indicators even if I slide the chart backwards. Something to do better next time.

2 Likes

Hi Quill,
Since you do not use stops how do you think about it if a trade goes against you? Do you give it any room or what do you do?

Andy

2 Likes

XLU trade, 1.96% loss. I bought this using price labels on SC, not BC. . Screenshots below.

Here are the BC charts I was not using…

The red smiley face above the bar on 6/20 was manually added by me. I manually add at the time I buy because sometimes, like in this case, they disappear. The smiley face was on the HA chart, but since I added one manually, it also shows up on the same date on the Regular chart. Hope that makes sense.

2 Likes

SH trade 2.2% loss
SPXS trade 3.3% loss

Bought using proper Stockcharts labels and day 2. One might quibble with not making the buy as early as 10AM. Notice that once again the labels are gone on stockcharts, so looking back 2 months from now someone could say there is no way you should have bought there. Charts don’t lie, old price labels do lie.

I am going to switch to only using Barcharts charts and abandon Stockcharts. Clearly something needs to change and my batting average is terrible even though I am using Rule #1 correctly.

1 Like

Maybe it is just a bad market for trading them. To choppy. Might want to try on Large Cap Stocks like the Mag 7

Andy

I suspect that in order to trade SS with anything remotely resembling the success that Quill claims, there are more Rules That Shall Not Be Named.

By definition, you are buying stocks that have undergone some sort of significant decline, and just ticked up. Is that in and of itself enough to have a successful trading system? I suspect not. There needs to be more to it. Otherwise the odds are that they will continue to trend down and make new lows.

I will continue to monitor and perhaps do some small trades–I’m still in NVDA–but I’m having a hard time seeing how just the 2 rules would give you a successful trading system.

I much appreciate those who are willing to share and discuss their trades in real time!

3 Likes

I am going to build out the Mike Webster screen for stocks near the 21dma and look for support there that could turn into a positive move. Maybe will keep with higher rated stocks.

I have also traded the big sector ETFs to no avail. Will keep trying with small positions. I am quite surprised how many price labels disappear on Stockharts

Sell Rule 2.2 sell if the “buy” price label disappears. (Which means the price went below it, so sell if you go below the smiley face price.

2 Likes

Pete, Look at CL. See how it hits the 50 day and bounces off of it with nice long uptrends before going back down. I think if you used Quill’s method on this you might get a nice return.

1 Like

Well, Quill’s method did not create a smiley face on the HA chart - I slid it around to check. I would have to use only that blue line to make the decision. Or, I could just buy anything that has good IBD rankings and bounces off the 50dma or 21dema.

Are using a non-HA (regular) chart and just looking at TSI crossover and green dots?

Thanks,

I am using an HA chart with wick along with a TSI crossover. The Green dots are just for minor confirmation. I was hoping you might look at it with stock charts and see how that works. I do not have access to stock charts and I thought that was your preferred method.

Andy

I thought Stockcharts was Quill’s preferred method, then all the price labels would disappear on me, so I mentioned I would switch back, but then Quill saw that and said he does indeed use SC, but glances at HAs. Sound like he really does not use HAs for decisions or out-of-the-gate. I will see what SC can do with similar studies.

1 Like

Stockcharts gave good label on CELH:

1 Like

Look at the intraday 1 min chart there is a fight going on with Celh.

Andy

CL 2HR HA chart - Use BUY/SELL label plus confirmation by 11EMA

1 Like

same 2Hr HeikinAshi chart on CCL - use Buy/Sell labels plus confirmation by 11EMA

1 Like

IOT 2hr HA chart - can use the buy/sell label with 10EMA confirmation, or can just simply use the 50EMA (blue line)

1 Like

Yes, I bought on 6/27 and am up 1.58% I forget If I used Stockcharts signals, probably.

Some SS3 stocks for discussion.

ALAB: If you missed the “Day two” buy, is it ok to buy now since the price is below Day-two, but above the price label day? Or, do you think the chart is wonky and should be going up for more days in a row? Personal preference?

NVDA: Same as ALAB, but it is above the 21dma, so much more appealling.

NXT: same as above, but ugly, volatile action. I am sure no one wants to touch this.

SPOT: same as NVDA, above 21dma, still at day-two price, but has been doing nothing for a while. So, yuck, why buy it now?

These are really just Koans to make us think about different scenarios.

@Quillnpenn I am going to respond to your teaching message from the “Trading Saul” thread to here so that more people might see it in the future.

RE: > If you want to be a successful Swing Trader hassle-free, Stick with Stockchart. Stay tuned!

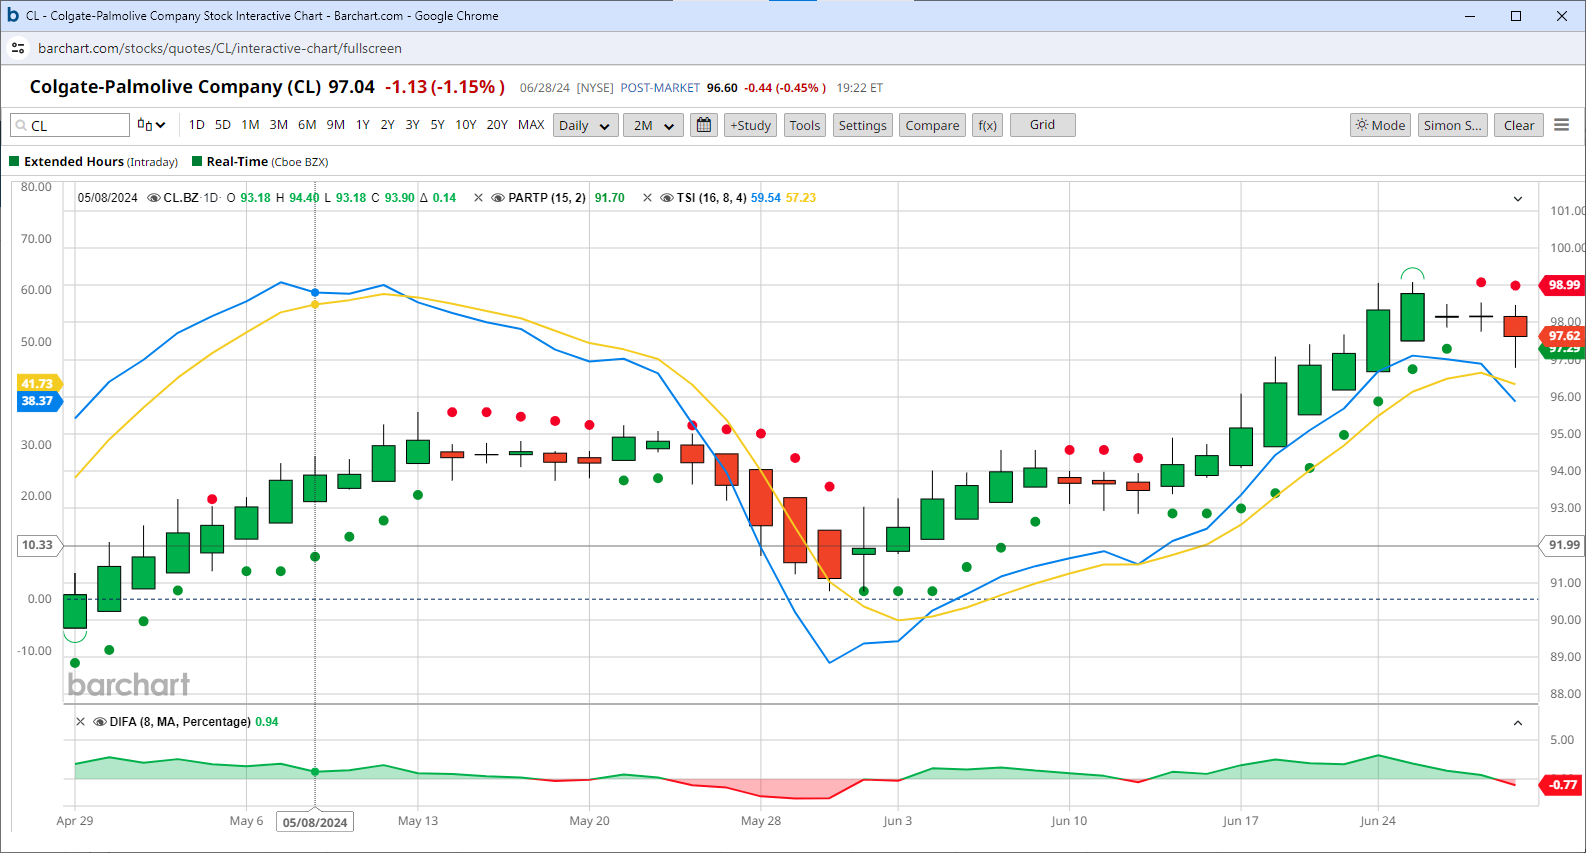
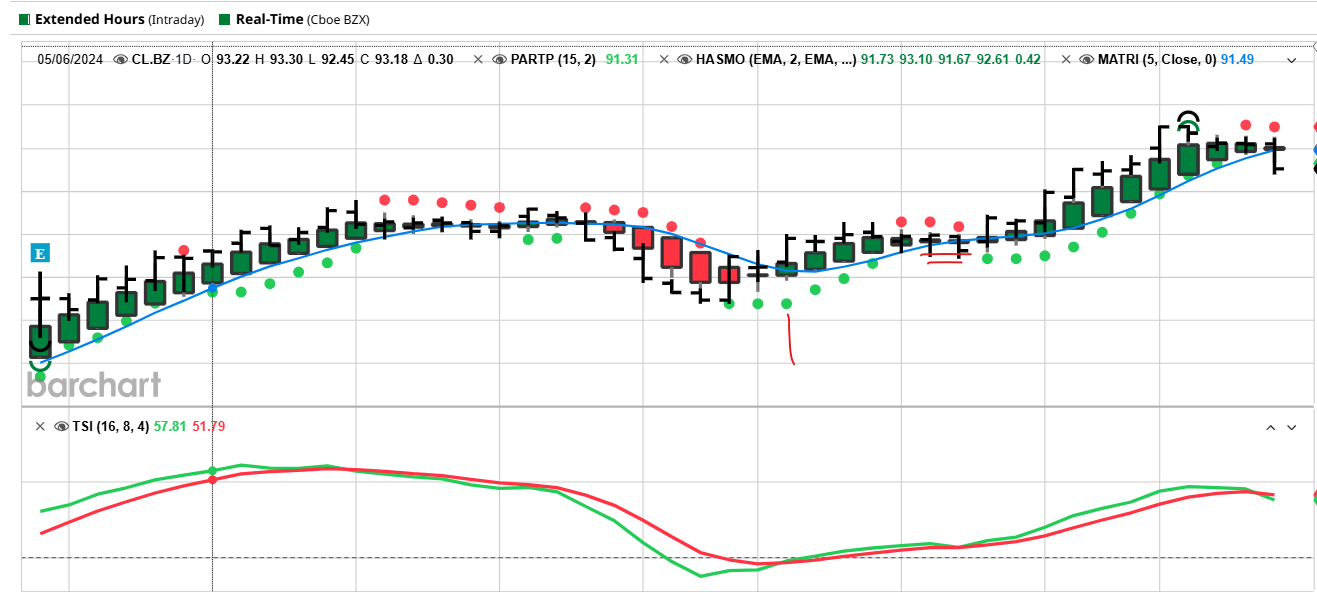
With Barchart, they give a lot of good information. But, I only LOOK at the 2-month chart on the screen and that’s it. I do nothing

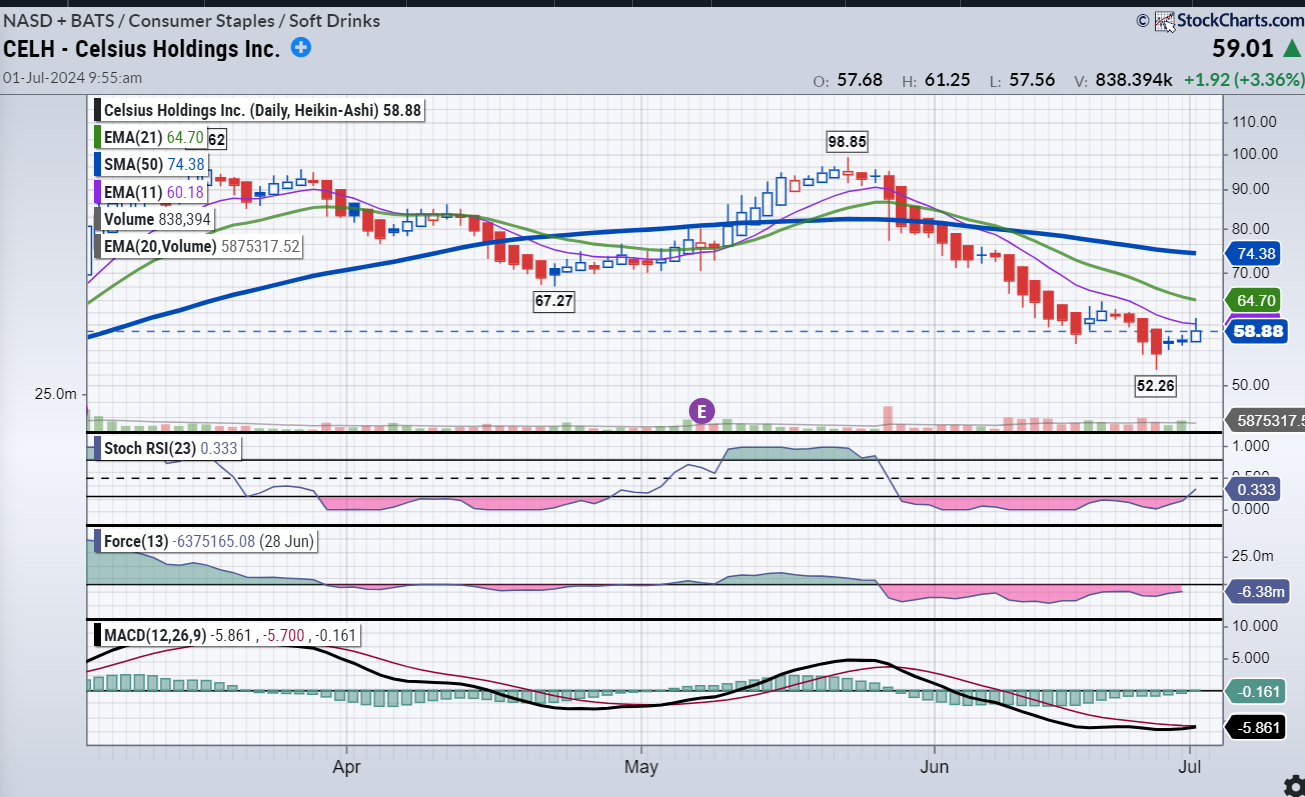
Quill, I will stick with Stockcharts, 2-month view, price-labels and stop using Barcharts.

RE:

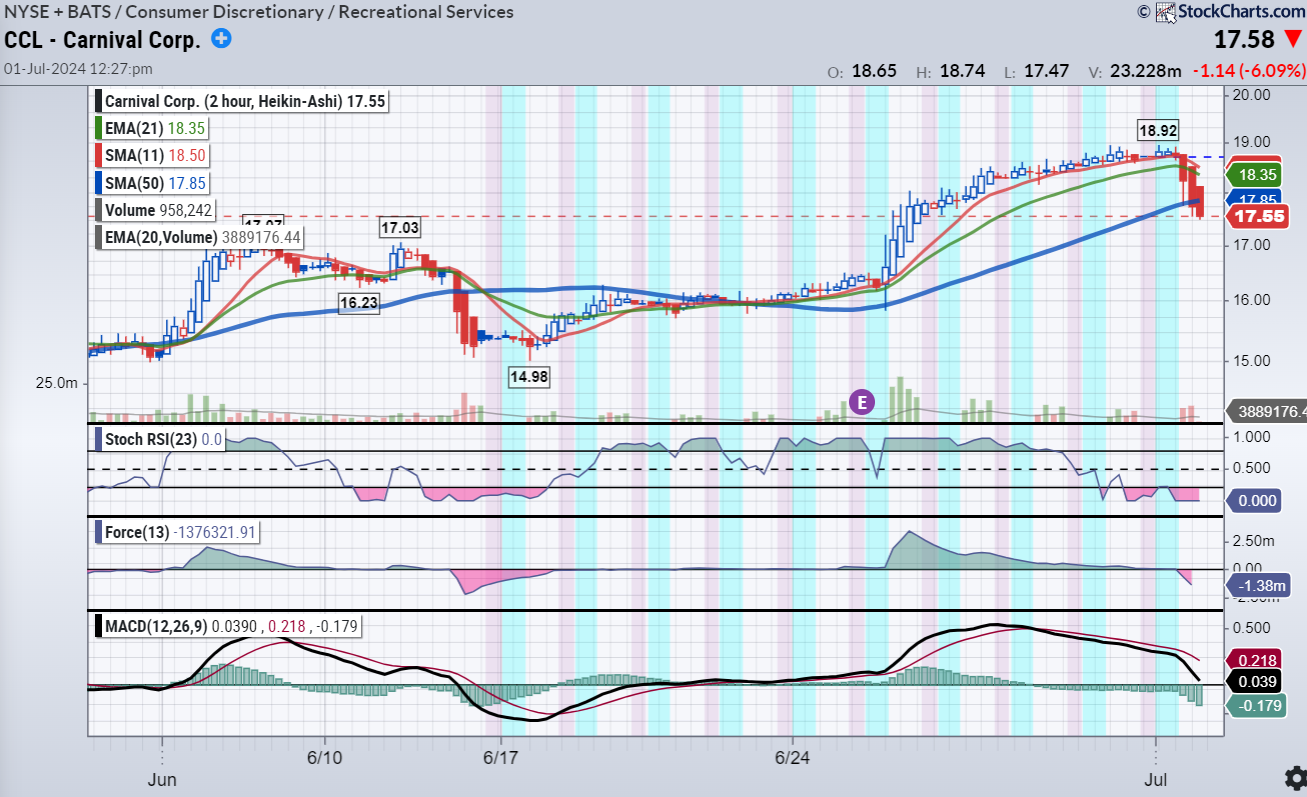
I want you to pay attention to the blue 20 ema very very carefully.

I will watch the 2dema as it acts like a magnet. In fact, I have planned to create a screen that shows good stocks withing 2% of the line.

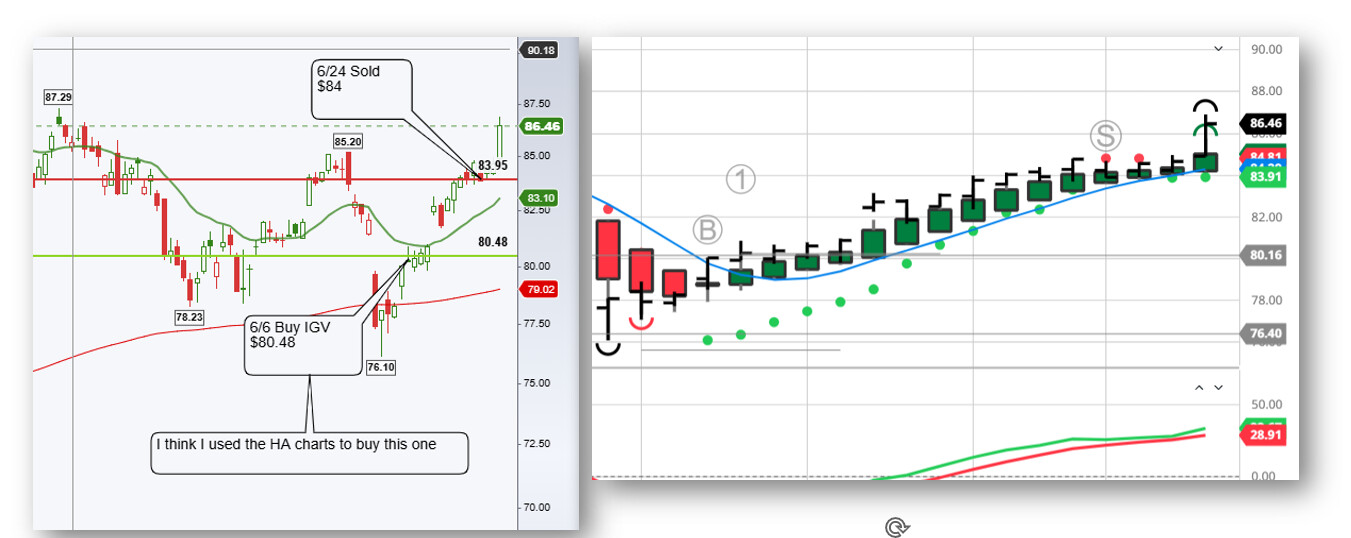
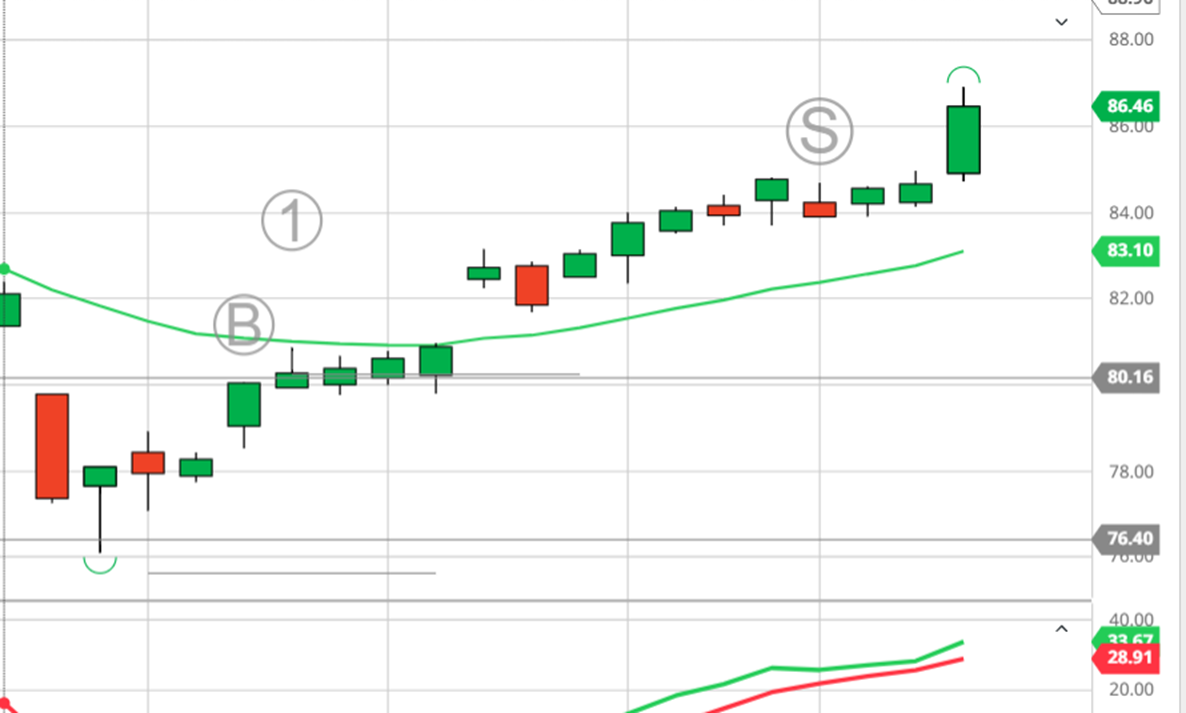
RE: Let’s do it another way and observe how I and my little 6th graders do it. Buy at the bottom, sell at the top

How is that different than buying after the low price-label and selling after the high-price label? Is it that you don’t wait for the first green day when buying, just buy as soon as you see a price label (which is never applied on the day of per Stockcharts FAQ)

RE: I would like to do is have COST, V, APPL and WM in your fixed Business Plan portfolio if you want to be a healthy wealthy Swing Trader as noted below.

Clarification: I have them on my “Great Stocks” watch list and will swing trade them per SS3, but are you suggesting I need a core holding of them and swing trade around that?

RE: > A sample line was thrown by a dart at my COST spreadsheet. Only 22 days.

1/29/2024 - bought 1,854,636 shares @ $689.87. Sold COST 2/12/2024 @ $717.49. Can you handle the profit made and compound the money and start the journey all over on the next trade? I sleep well at night counting sheep.
Bang on the Abacus. Thank you, Simon.

I banged on the Abacus and is says you invested $1,279,457,737.32. Is that correct? The share count was very precise! I know you are Richie Rich rich, but do you really have $1.2 billion laying around?

Here again we see how the price labels have disappeared from the Stockcharts chart of COST, the chart below is marked for 1/29/24 and 2/12/24. I guess it only matters in real time. But clearly you can’t show a chart and point to old labels as where we would have bought and sold. I suspect all the short term (thus bad) labels all disappear. Very strange.


s

RE:

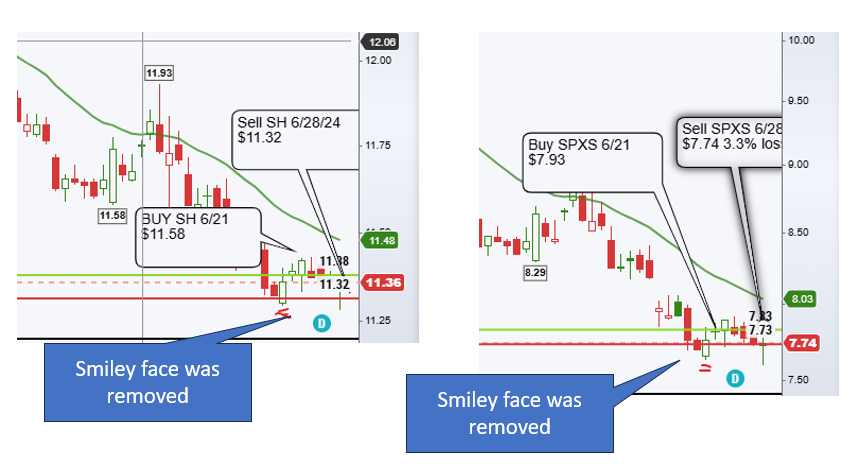
I only lost 3 times out of 160 trades.

Clearly I need to pick better price labels my batting average is very bad as posted on the “real time” board. I will keep working hard to find the magic.

RE: > IBD and Saul & Co. are the worst places to learn how to be a successful Swing Trader.

P.s.s. I use Traders Pro with a lifetime subscription.

Totally agree! IBD was founded on Position Trading, which is how Bill made his millions. They do have a swing trading service not, but I will not try it. Saul, like you, has a history of amazing results. He does not swing trade. His current approach is to find “hyper-growth” companies with the intent of holding “forever”, which is as long as earnings are awesome and the stock is going strong. He is always 100% invested (aside from safety cash for multiple years of living expenses)

Thanks again, I will keep honing my skills and pestering you with refinement questions.

Pete

2 Likes