I had been a user of StockMarketEye software for a couple years. It was pretty good, but running into problems. The owner shut it down last summer, and I’ve been adrift since then.
My portfolio has too many positions for a spreadsheet to work well, around 60 different stocks.
I’ve finally settled on Sharesight, a SaaS package, but the reporting is, let’s say, less than complete. I download several reports and do my own reporting on top of what Sharesight provides.
What are you doing to keep track of your portfolio and to help you make decisions about your investments? What do you like about the way you’re doing it? What do you wish were different?
I use Quicken, ThinkOrSwim, and the Fool’s tools. Quicken lets me easily cover multiple accounts. ThinkOrSwim has good Technical Charting, and the Fools tools has a great community backing them up.
In the past, I used monthly paper statements, quotes from the Sunday paper and a spreadsheet. At the time, it was Ok.
In the mid-1990’s I switched to Quicken and started using it for our portfolio. Kept the spreadsheet.
Started using the spreadsheet more in early 2000’s until the download interface broke. It was fixed and broke again.
Around Christmas 2016, I started writing some model code and started making a data plan for a portfolio program. I started coding in March 2017 having decided on a 3 program approach:
port_d: A daemon to download quotes from Yahoo Finance for stocks, funds and options pricing with other data. It writes files that the other programs use for input.
portfolio_mng: A character-mode program to record all purchase. sales, dividend, cash, etc info.
portfolio_monitor: A character-mode display program. This read data provided by the other programs and updates as any changes are made.
I went live with it on Sep 2, 2017. Since then I have gone through a few update evolutions. The biggest was converting the portfolio_monitor from character-mode to using Tk. I originally used ROText widgets for most of the display but converted them to using Label widgets in Frames. This added another daemon, port_info_d, to digest data and format it for display.
Then Yahoo Finance turned-off their data interface and I scrambled to find another data source. I settled on finhubb.io. But they don’t supply all the info I need so I setup a spreadsheet on Google for the 52 week high/low and the indices like the DOW, NASDAQ, etc. I use the File/Download function and the port_d daemon processes the file.
I would not want to even guess how many hours I have dedicated to this over the past seven+ years.
Wow, @gdett2, that’s very impressive! I don’t want to put that kind of time into building my own solution, and I thought that surely the market would provide a better answer than Quicken or Excel by now – but if there is a commercial off-the-shelf solution available now that works well, I haven’t seen it yet. Sharesight, the package I’m using right now, is pretty half-assed and I wouldn’t recommend it to others.
Nonetheless, I have to admire your dedication to building a solution that works for you, and that has enabled you to adapt to a changing environment for nearly 10 years. Congratulations!
The advantages of building one’s own tracking and evaluation tools are two fold. One is the ability to customize. The other is that the tracking is active, not passive.
To manage my portfolio, I employ a variety of strategies and tools. My bank and investment accounts are integrated with Personal Capital’s financial dashboard, which I use for general tracking. I use Seeking Alpha’s advanced capabilities in conjunction with Google Sheets to do in-depth analysis and tracking of individual stocks. Though I appreciate that Seeking Alpha allows me to personalize my tracking and offers thorough results, I think that more integration possibilities and real-time updates would greatly improve the process’ efficiency. How does Sharesight’s multi-report management work for you?
I’ve spent months just trying to get all my data into Sharesight and validate that it’s doing the right things with the info. It’s fairly rigid, as a system, and isn’t capable of simply sucking in my data electronically (from Fidelity, no less – why would they support the largest broker in the world??).
So I haven’t played around all that much with the reports yet. Garbage in, garbage out, right? That said, I do see some nifty reports, such as one that shows how each stock in the portfolio has contributed to returns in a given period.
I run multiple portfolios, each with its own highly differentiated performance goals, so this kind of analysis is helpful. That said, I’d also love to be able to report across portfolios, so that I could look at overall performance. That’s just not something Sharesight is equipped to do, unfortunately.
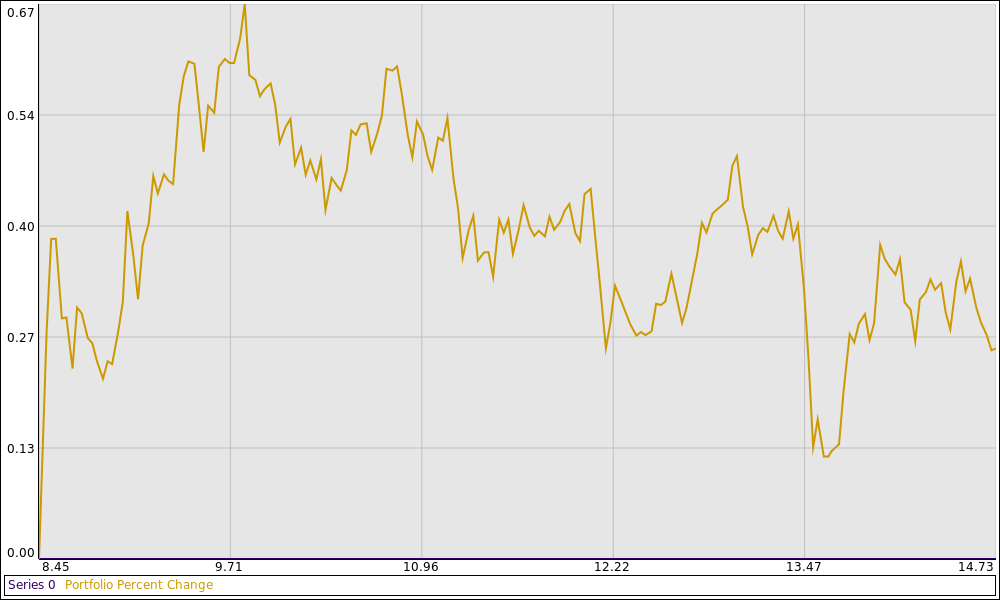
Yesterday I decided I want to automatically create a graph of the portfolio value changes as the quotes are downloaded through the day. It took a couple hours of trying a couple of modules but decided to use the Chart::Clicker module. It has limitations but it works Ok for what I wanted. This is today through 1445 (2:45PM):
A minor issue is the labeling for the x-axis label must be numeric. When I used actual times like 0900 through 0959, the module assumed 0960 to 0999 were missing points and graphed a straight line for that series. So I made the times as hours plus the percentage of the hour. (30 minutes = .50, 45 minutes = .75)
I added the code to one of my daemons and it updates the graph every time the quotes are downloaded.
If the file is open in imageviewer, it shows the file with the updates as the file is rewitten.